blog authors
past blog entries

Welcome to the Kellylab blog

geospatial matters

Please read the UC Berkeley Computer Use Policy. Only members can post comments on this blog.

Entries by Maggi (501)

Sunday
Nov012015

MODIS and R: a dream partnership

Found by Natalie: 

Tuck, Sean L., Helen RP Phillips, Rogier E. Hintzen, Jörn PW Scharlemann, Andy Purvis, and Lawrence N. Hudson. "MODISTools–downloading and processing MODIS remotely sensed data in R." Ecology and evolution 4, no. 24 (2014): 4658-4668. And it is Open Access!

Abstract

Remotely sensed data available at medium to high resolution across global spatial and temporal scales are a valuable resource for ecologists. In particu- lar, products from NASA’s MODerate-resolution Imaging Spectroradiometer (MODIS), providing twice-daily global coverage, have been widely used for eco- logical applications. We present MODISTools, an R package designed to improve the accessing, downloading, and processing of remotely sensed MODIS data. MODISTools automates the process of data downloading and processing from any number of locations, time periods, and MODIS products. This auto- mation reduces the risk of human error, and the researcher effort required compared to manual per-location downloads. The package will be particularly useful for ecological studies that include multiple sites, such as meta-analyses, observation networks, and globally distributed experiments. We give examples of the simple, reproducible workflow that MODISTools provides and of the checks that are carried out in the process. The end product is in a format that is amenable to statistical modeling. We analyzed the relationship between spe- cies richness across multiple higher taxa observed at 526 sites in temperate for- ests and vegetation indices, measures of aboveground net primary productivity. We downloaded MODIS derived vegetation index time series for each location where the species richness had been sampled, and summarized the data into three measures: maximum time-series value, temporal mean, and temporal vari- ability. On average, species richness covaried positively with our vegetation index measures. Different higher taxa show different positive relationships with vegetation indices. Models had high R2 values, suggesting higher taxon identity and a gradient of vegetation index together explain most of the variation in species richness in our data. MODISTools can be used on Windows, Mac, and Linux platforms, and is available from CRAN and GitHub (https://github.com/ seantuck12/MODISTools). 

Tuesday
Oct272015

SAHM: VisTrails Software for Species Distribution Modeling

Shane just turned Michelle Koo and on to this software package: The Software for Assisted Habitat Modeling for VisTrails. It seems very useful for a generalized SDM workflow. 

From their blurb: The Software for Assisted Habitat Modeling for VisTrails has been created to both expedite habitat suitability modeling and help maintain a record of the various input data, pre- and post- processing steps, and modeling options incorporated in the construction of a species distribution model. SAHM is constructed as a "package" of modules that can be used within VisTrails, an open-source management and scientific workflow system designed to integrate the best of scientific workflow and scientific visualization systems. SAHM works by combining environmental predictor layers of the study area — such as climate and remote sensing data — with field sampling measurements for a particular species. The program then runs statistical models using these data to analyze habitat requirements of the species of interest and predict its potential distribution based on habitat suitability. Model outputs help land and natural resource managers generate maps to aid in predicting and managing species of concern.

https://www.fort.usgs.gov/products/23403

Wednesday
Oct212015

GIS Day 2015! Happy 10th Birthday to the GIF

Please join us for GIS Day 2015!  

You are all welcome to visit us at the Geospatial Innovation Facility for this year’s GIS Day Celebration on Wednesday, November 18th. This year’s event is co-hosted by the GIF and BayGeo (formerly the Bay Area Automated Mapping Association, or BAAMA). 

Not only are we celebrating all things geospatial for GIS Day, we are also celebrating the GIF’s 10th year anniversary! The GIF was formally started at a GIS Day event in 2005. As in previous years, we will be having a poster session, many exciting talks, and refreshments. It is a great time to network and catch up with what is going on with mapping around the SF Bay Area. 

Instead of a Keynote talk, this year we will be holding a Plenary Session in the early evening with local innovators from Bay Area Industry, Government and Non-Profits (including Stamen, PlanetLabs, Google, 3DRobotics, GeoWing, iNaturalist, and NASA) who all focus on state-of-the-art geospatial technology and solutions. The discussion will cover such topics as what skills they look for in recruiting, where they see the geospatial world going in the next 5 years, and how we can better partner around the bay to stay at the forefront of the geospatial revolution.

GIS Day is free and open to the public but we do request that you RSVP, so we know how many participants to expect! Also, we are inviting the geospatial community to participate in GIS Day during our poster, lightening talk, and presentation sessions.  If you’d like to present your work or display a poster, please indicate your interest on the RSVP form. Our RSVP form allows you to register your poster or to be considered for a presentation slot. Please include the title and a brief abstract for your proposed poster or talk on that form. Topics are open to anything geospatial! If you’d like to attend GIS Day 2015, please RSVP here: http://goo.gl/forms/3mj30lc6eS


What: GIS Day 2015 @ the GIF

Location: Mulford Hall, UC Berkeley

Date: Wednesday, November 18th

Time: 5pm – 8:30pm

Tuesday
Oct202015

Where is the best source for NAIP information for California? 

How many times has NAIP been acquired for California? 
According to DFG, we have:

  • NAIP 2014 aerial imagery, 1 m, 4 variations (natural color, 4-band, CIR/false color, NDVI)
  • NAIP 2012 aerial imagery, 1 m, 4 variations (natural color, 4-band, CIR/false color, NDVI) 
  • NAIP 2010 aerial imagery, 1 m, 4 variations (natural color, 4-band, CIR/false color, NDVI) 
  • NAIP 2009 aerial imagery, 1 m, 4 variations (natural color, 4-band, CIR/false color, NDVI) 
  • NAIP 2005 aerial imagery, 1 m (natural color)

I was not aware the flight schedule was this frequent. 

Still, I can't find a definitive information source that helps. 

Wednesday
Oct142015

GIS-related courses for Spring 2016

Hello World!

There are several GIS classes to chose from in the spring. So far we have: 

Lower division:

  • ESPM 72 Geographic Information Systems *Not sure who is teaching this yet*

Upper division:

  • Biging, G & Radke, J ESPM 177 GIS and Environmental Spatial Data Analysis
  • Chambers, J    GEOG 185    Earth System Remote Sensing   
  • O'Sullivan, D   GEOG 187 Geographic Information Analysis

Graduate:

  • Radke, J    LDARC 221    Quantitative Methods in Environmental Planning
  • Dronova, I LDARC 221 Applied Remote Sensing
  • Chambers, J GEOG 285 Topics in Earth System Remote Sensing
  • Wang, I   ESPM 290 Special Topics in Environmental Science: Spatial Ecology

Email me with others. 
Thanks!

Wednesday
Sep232015

Fall 2015 ANR GIS training schedule

Hello everyone in extension! Our IGIS workshop schedule for the fall is here. We have some great workshops scheduled for your geospatial pleasure.  These are coordinated with the workshops provided through the GIF

Fri, Sep 18 11am-4pm Hopland Research & Extension Center Web GIS and Mobile Data Collection
Wed, Oct 7 8am-12:30pm Sheraton Grand Hotel, Sacramento JSIC - Web GIS and Mobile Data Collection for ANR
Mon, Oct 19 11am-4pm UC Riverside Intro to GIS: Crop Agriculture Focus
Tues, Oct 20 11am-4pm

UC Riverside

Web GIS and Mobile Data Collection
Fri, Nov 20 10am-5pm UC ANR Building, Davis Intro to GIS: Forestry Emphasis
Fri, Dec 4 1pm-5pm UC Berkeley Web GIS and Mobile Data Collection
Thur, Jan 21 11am-4pm Lindcove Research and Extension Center Intro to GIS: Crop Agriculture Focus
Fri, Jan 22 10am-3pm Lindcove Research and Extension Center Web GIS and Mobile Data Collection
Wednesday
Sep232015

GIF+CartoDB workshop coming up! Oct 2

Free Workshop: Intro to CartoDB for Online Mapping

Andy Eschbacher, Map Scientist with CartoDB, will visit the GIF to teach this special hands-on workshop.CartoDB.com is a versatile cloud-powered spatial database, mapping, analysis and visualization engine that facilitates the process of building spatial applications for both web and mobile devices. The platform is currently used by major news organizations, research institutions, non-profits and geospatial application developers. This hands-on workshop will provide an introduction to managing, creating and analyzing spatial data and creating interactive map visualizations for the web, using the CartoDB platform.

If you are interested, you need to register here

Wednesday
Sep162015

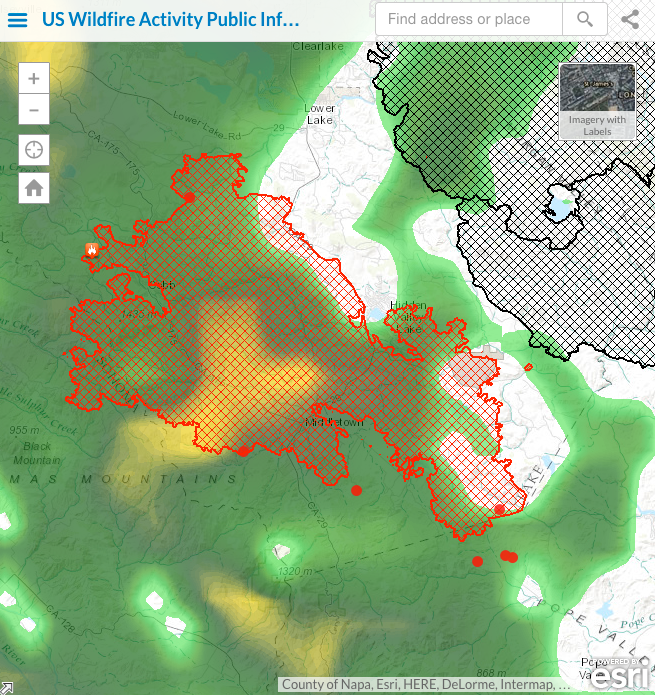
It is raining on the Valley Fire, thank goodness

Been addicted to the ESRI fire feed for its integration of numerous data sources. 

Here is the Valley Fire currently, and the rain that just hit us has moved north. 

For more: http://www.esri.com/services/disaster-response/wildlandfire/latest-news-map

Wednesday
Sep022015

International Map Year

Did you know that it is International Map Year? 2015-2016.  

The International Map Year (IMY) is a worldwide celebration of maps and their unique role in our world. Supported by the United Nations, IMY provides opportunities to demonstrate, follow, and get involved in the art, science and technology of making and using maps and geographic information.

http://mapyear.org/about-international-map-year/

Think about ways in which maps can be integrated into your work!

Wednesday
Sep022015

False precision in the English Lidar release

Great commentary from Martin Isenburgon of LASTools fame on releasing data with false precision. This deals with the new open data release by the Environment Agency in England. So far LiDAR-derived DTM and DSM rasters have been released for 72% of the entire English territory at horizontal resolutions of 50 cm, 1 m, and 2 m. They can be downloaded here. The rasters are distributed as zipped archives of tiles in textual ASC format (*.asc). 

Martin gives us a cautionary tale on how not to release national data. It is not the ASC format that he has problems with, but the vertical precision. He says:

"The vertical resolution ranges from femtometers to attometers. This means that the ASCII numbers that specify the elevation for each grid cell are written down with 15 to 17 digits after the decimal point."

Example heights might be something like: 79.9499969482421875 or 80.23999786376953125. These data should be resolved to about the cm, not attometer, whatever that is. Crazy man!

Read the full post: http://rapidlasso.com/2015/09/02/england-releases-national-lidar-dem-with-insane-vertical-resolution/

Page 1 ... 3 4 5 6 7 ... 51 Next 10 Entries »