blog authors
past blog entries

Welcome to the Kellylab blog

geospatial matters

Please read the UC Berkeley Computer Use Policy. Only members can post comments on this blog.

Entries in conferences (31)

Monday
Aug082016

ISECCI historical ecology working group wrap-up

Last week Kelly and I with others travelled to the Sierra Nevada Aquatic Research Lab (SNARL) in the eastern Sierra Nevada, just south of Mono Lake for a research retreat. SNARL is part of the UC's Natural Reserve System, which is comprised of nearly 40 properties across the state. These are preserves that foster research, education and collaboration. They have much in common with ANR's REC system. I've been to a few of them now, and am very pleased to make more visits. I love the east side of the Sierra, and that iconic Highway 395. 

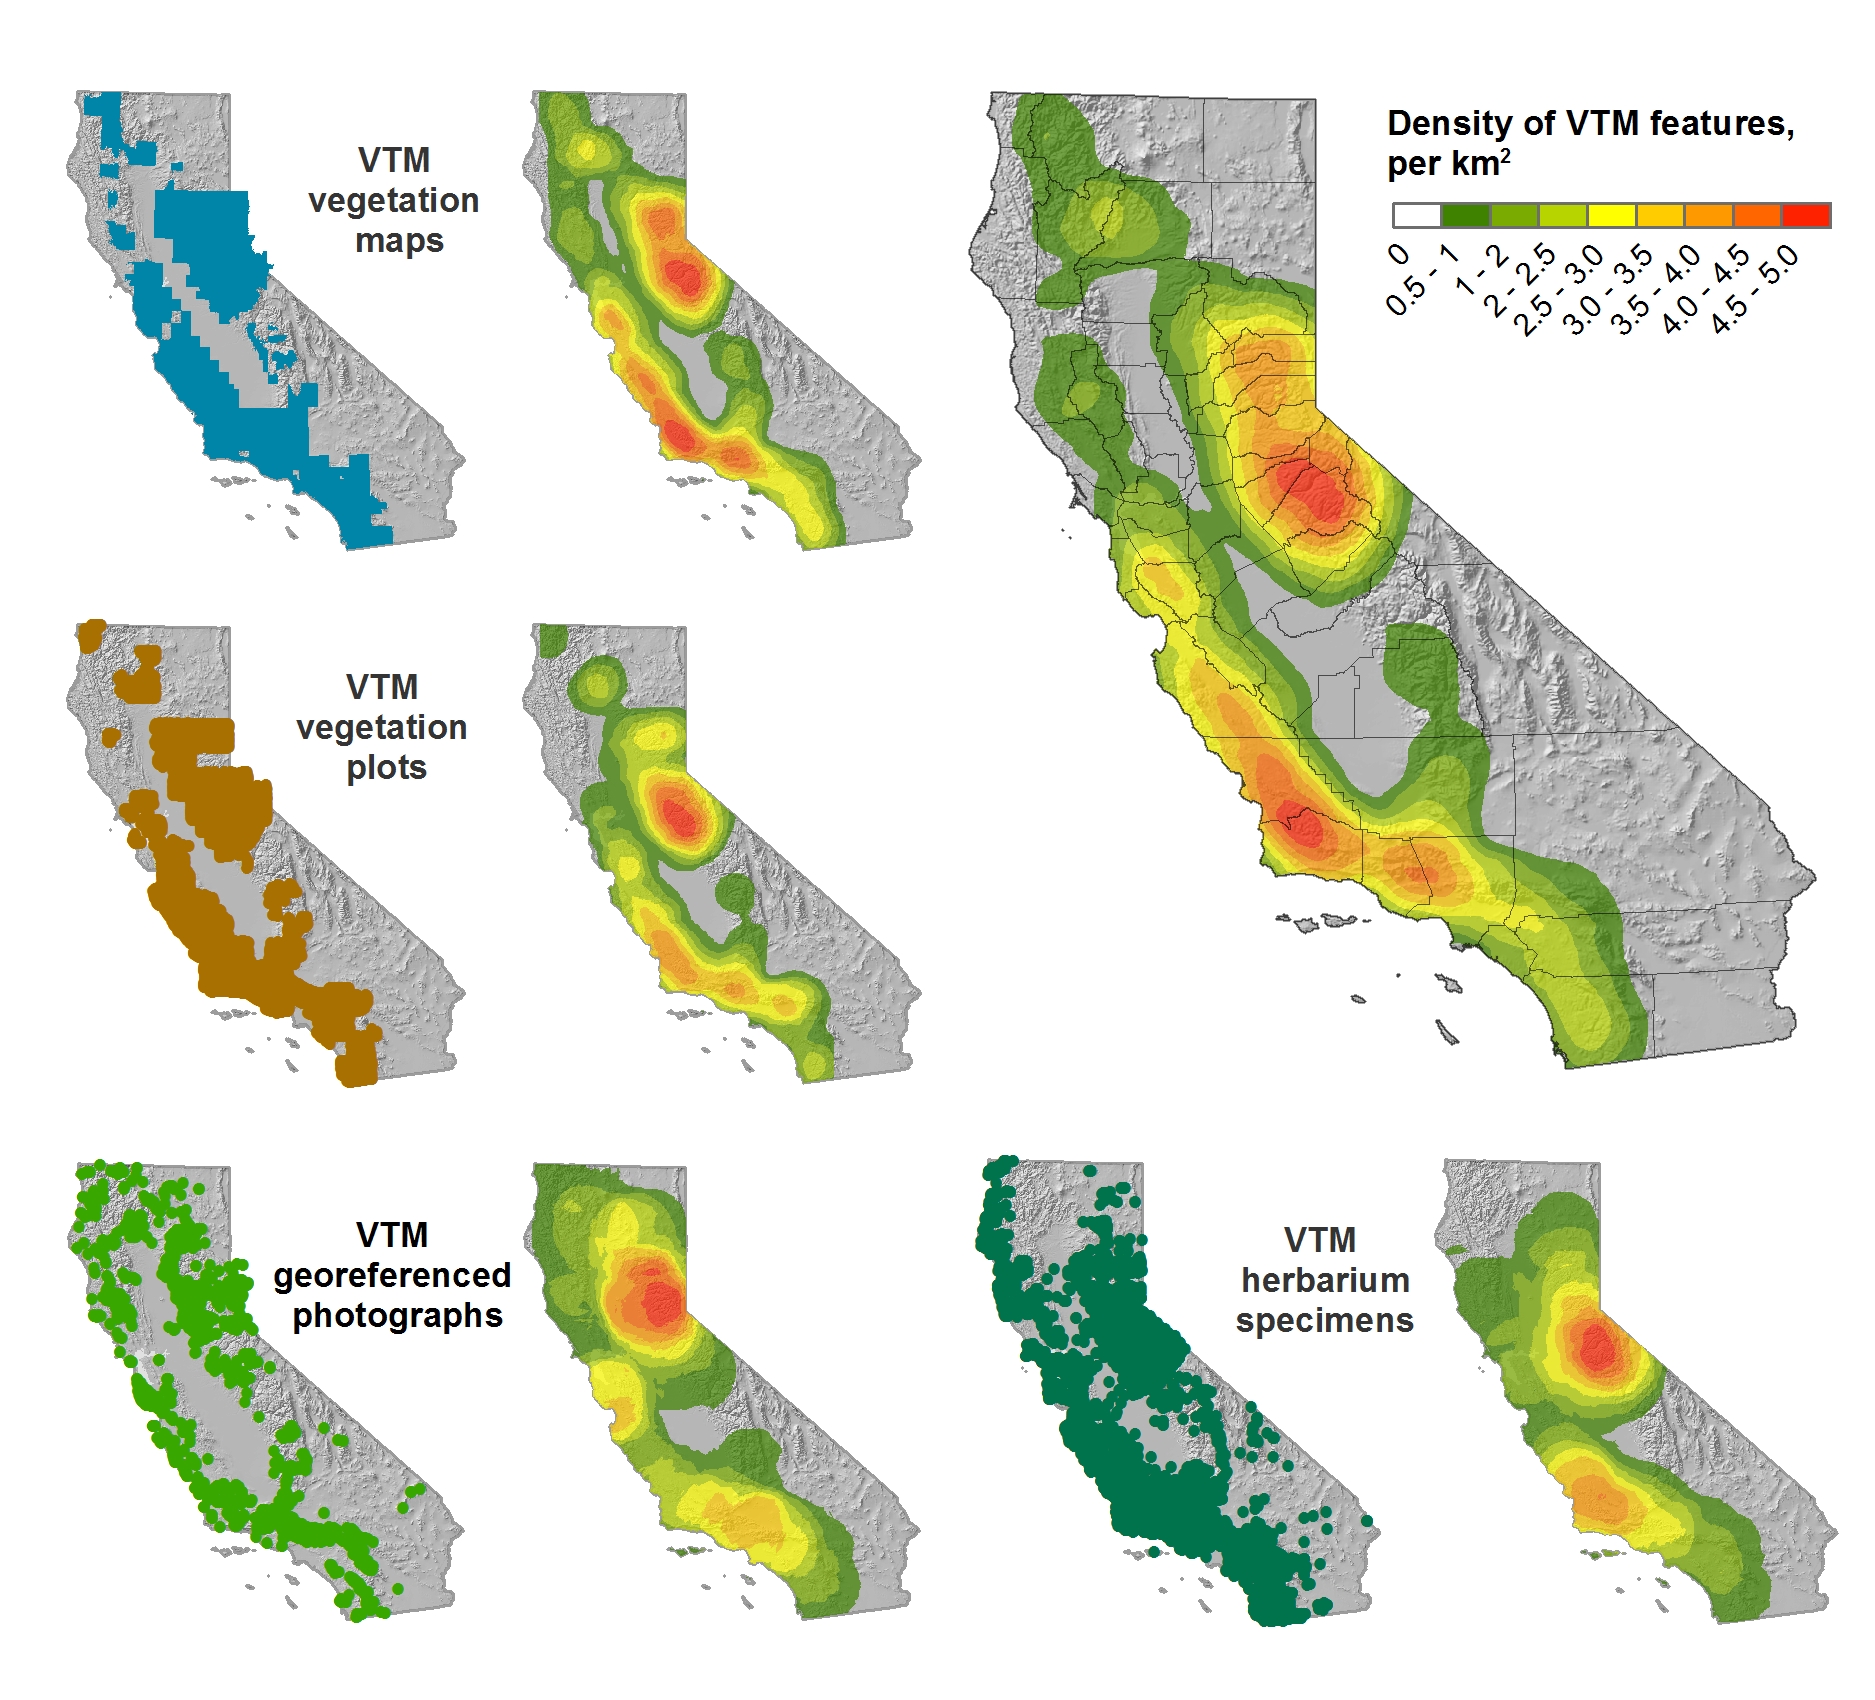
This trip was a retreat for the ISECCI historical ecology working group, led by the inspirational Peter Alagona from UCSB. We discussed our existing projects, including the VTM work (see figure below), and talked about potentials for more collaborative research and further integration between NRS and ANR. We have a list of wishes for digitization, and if anyone out there has ideas about pitching these to donors, please let me know. For example: 

  • Kelly and I want to digitize the Leiburg maps from the northern Sierra to add to the VTM stack;
  • We want to find a better way to index and view historical aerial photography state-wide. Something like this for historical maps: http://ngmdb.usgs.gov/maps/TopoView/help/

And we had a field trip looking at Mono Lake water issues. Great time spent!

Density of VTM features across the collections

Tuesday
Jun282016

I for one welcome our ESRI overloards: Wrap Up from the 2016 ESRI User Conference

What a full week! Here is my wrap-up from a great 2016 ESRI User Conference.

I haven't been here in many years, and I am glad I came. I learned much, and have some new ideas for workshops and classes, and how IGIS can be more of service to ANR, and I got started on ArcGIS Pro - ESRI's eventual replacement for ArcGIS Desktop. Pro has a completely new user interface that is very clear; you can visualize, edit, and perform analysis in both 2D and 3D; it is super fast via multithreading & 64-bit processing (finally), and it has new icons and a bunch of new processing tools. A bunch of very cool stuff comes with 1.3 soon. 

Day 1: Monday was spent in big-picture, inspirational talks from camera beautiful GIS people. 15,000 in the audience, 10 massive screens. I loved it, I felt like I was at a really intense but sedate rock concert. Note to ESRI: could you put the chairs any closer together? The highlight was speaker keynote Andrea Wulf, talking about her obsession with Alexander Von Humboldt.  Note to self: get the book. In addition to the big picture stuff, Day 1 is ESRI's chance to highlight this year's software improvements as we continue the voyage away from the desktop workflow: Pro, integrated 3D, green design, Apps, seamless integration with the web. 

Day 2: Tuesday focused on workshops. I picked four workshops from the Spatial Statistics Team at ESRI. These were led by Lauren Bennett and her crew (Flora Vale, Jenora D'Acosta). Uniformly fantastic. I had downloaded Pro the night before, and with some trepidation got started and followed along. I am happy to report that it seems very intuitive. I have read elsewhere about worries that there is loss of cartographic control, and I will look into that. I learned about the Spatial Stats toolbox in Pro, and some very new capacity in optimization of pattern analysis (you know how difficult it is to pick that distance kernel), and in the new space-time cube capabilities. The space-time capabilities make very complex analyses doable, and are very exciting, but still a bit constraining if you don't know how to update the code. Oh yeah, and space-time uses netCDF format. 

Day 3: For Wednesday's workshops I chose workshops that would help me update class labs: Python + Raster analysis; Site suitability in Pro; Cost Connectivity in Pro; and some crazy cool prediction tool called Empirical Baysien Kriging, which I will be checking out.  I guess EBK has been around for awhile, but now implemented in ESRI software. The new suite of tools in site suitability + connectivity are going to be key. Kevin M. Johnston and Elizabeth Graham led the Site Suitability and Connectivity, and Eric Krause led the Kriging workshop. 

Day 4: All day was spent in Pix4D immersion with the excellent Pix4D support/training team. Pix4D is the gold standard for drone imagery workflow; it also serves as the backend engine for ESRI's Drone2Map application, which I have not tried. Most of the morning was spent in basics: workflow basics, application domains, super wow factor examples like 0.5cm resolution imagery processing. We also looked at workflow and best practices, accuracy, and some example projects. The room was full of 50+ people, many with specific questions about a range of projects. Got to hang out a bit with Greg Crustinger, who is now at Parrot. Even more excited now about our new Sequoia cameras. 

Thoughts:

  • Little Italy has some great restaurants. 
  • We need to move to Pro soon. Probably not in time for Fall's class, but soon. GIF and IGIS workshops are going to have to get updated. 
  • I need to get more in touch with imagery analysis in Pro. Especially with the segmentation and classification part. 
  • I want to recreate the workflow for site suitability + locate regions + cost connectivity soon. 
  • The ability to perfom complex analyses in a GUI is increasingly easy, but is that a good thing? We have to be increasingly vigilant about training the fundamentals as well. 
  • One frustration about these workshops that I bet my workshop participants share - the data all is perfect, and ready to go. We need to keep talking about where to get data, and how to wrangle it into shape. 
  • Could drones mean the resurrection of photogrammetry? At least in the classroom?

Trends: 

  • Hyper granularity: how do we processes these increasingly fine resolution datasets? 
  • Global to local focus in modeling: GWR, optimized Getis-Ord, empirical baysien kriging all try to deal with and model local variability across a complex study area;
  • Incorporation of permutations and distribution functions in modeling has been made way easier;
  • Big Data, multidimensional data, temporal data: ESRI is really trying to be a better informatics platform for research;
  • ESRI seems to be increasingly relying on external and open standards for new data formats/products; this is a great trend;
  • Decision-making: all these analyses need to support decision-making; communication remains critical, tools for web-based interaction continue to expand.
Saturday
Apr022016

AAG 2016 wrap up

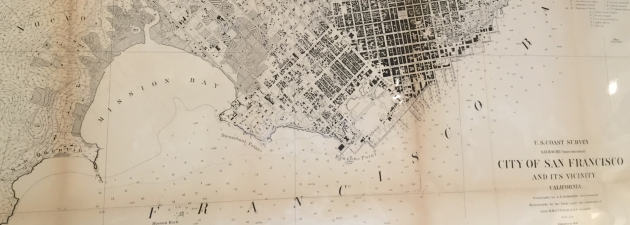
1870s-ish map of SFAside from all the sunshine, architecture, maps, and food, at the 2016 AAG conference Kelly and I participated in four organized sessions on Historical Ecology. On Saturday, we heard from a number of fantastic researchers, and here is my wrap-up.  (Alas, these sessions overlapped with sessions on CyberGIS, Who says you can't be interestd in both? cyber-historical-environmental-spatial-data-science.)
  • History: We heard from researchers working on data from the Holocene, to pre-history, to the 20th century.
  • Focus: Ecosystems included prairie, forests (Maryland, New York, California, Florida, Ohio); and Wetlands (China, California, etc.); Land Use and Agriculture (Mexico, Brazil); Fire (Arizona); and biological collections. 
  • Data included inventory (PLS system: land appraisal value; Cadastral surveys); Imagery (Landsat, aerial imagery); and biological (paleo; tree ring; resurveys; pollen records; bird census; and PLS system: witness trees, survey lines, FIA data). 
  • Methods: Comparison between past and present from existing inventory data, as well as comparison between historic and modern resurveys; digitization of multiple data sources; narrative analysis; ecological modeling; ecosystem services modeling; fire behavior modeling; OBIA of historic imagery; and some really neat modeling work. 
  • Emerging Themes from the sessions included: 
    • Data. Most people used digital data from an existing source - websites, clearinghouse, existing digital source. Many digitized their data. One person used an API. 
    • Accuracy. About half of speakers have thought about, or incorporated understanding of data quality or uncertainty in your work; but this is difficult to do quantitatively. Some people use the 'Multiple lines of evidence' from diverse datasets to increase confidence in results. 
    • Tools. We heard about a number of tools, including GIS as desktop tool, Open tools, Backcasting with landcover models, Complex modeling approaches, One paper used OBIA methods, and one paper discussed Big historic data (maybe moving toward the cyberGIS overlap). 
    • Theoretical frameworks: A few papers used resilience as a framework, social, ecological and coupled; and several papers used a landscape ecology framework. 
    • New terms: I learned a new term: “Terrageny”: a record of how a landscape became fragmented through time, containing information on the ‘ancestry’ of fragments and showing how an initially continuous landscape was progressively divided into fragments of decreasing size. Ewers et al. 2013. Gorgeous word. Must incorporate into cocktail party discussion. 

We also sent out a survey to the speakers prior to the talks, and here are some preliminary results. 

Question: What are the three top challenges that you see for historical ecology research?
  • Data/Logistical/Availability
    • The further back in time we look, the more sparse the data. 
  • Technical 
    • Lack of metadata: Current data deluge may attract attention/urgency away from the discovery and digitization of historical data;
    • Few models capable of incorporating human and environment interactions over long time scales. 
  • Theoretical
    • Maintaining perceived relevance in the context of the novel ecosystem/no-analog system conversation - not having historical ecology be the baby that is thrown out with the bathwater.
  • Operational 
    • Many respondants mentioned issues with funding - these projects are by nature interdisciplinary, often require large programs to fund at achievable levels, and not many funding sources exist.
  • Communication
    • We need to focus on communicating the importance of understanding past conditions to inspire and guide current design proposals. 
Question: What exciting future directions do you envision for historical ecology research?
  • The importance of historical data and analysis:
    • Historical data is essential: Multi- Inter-disciplinary research needs historical research, particularly so that we can understand 1) historical reference conditions, but also so that we can understand 2) when we might have novel interactions between species and ecosphere. 
  • Practicality of historical data and analysis: 
    • Historical ecology is critical for restoration projects and for studying climate change, and for its power to communicate through environmental education with the public.
  • New data/Big data/Data Fusion: 
    • Increase in digitally available historical sources (longer ecological and climate records and reconstructions), plus the availability of large, high-resolution datasets to assess change (thinking LiDAR, government reports, survey data...)  
    • There is also increasing sophistication of analysis and visualization tools.
    • But, the current data deluge may attract attention/urgency away from the discovery and digitization of historical data.

A fantastic time was had by all!

Saturday
Apr022016

Spatial Data Science Bootcamp 2016!

Last week we held another bootcamp on Spatial Data Science. We had three packed days learning about the concepts, tools and workflow associated with spatial databases, analysis and visualizations. Our goal was not to teach a specific suite of tools but rather to teach participants how to develop and refine repeatable and testable workflows for spatial data using common standard programming practices.

2016 Bootcamp participants

On Day 1 we focused on setting up a collaborative virtual data environment through virtual machines, spatial databases (PostgreSQL/PostGIS) with multi-user editing and versioning (GeoGig). We also talked about open data and open standards, and moderndata formats and tools (GeoJSON, GDAL).  On Day 2 we focused on open analytical tools for spatial data. We focused on Python (i.e. PySAL, NumPy, PyCharm, iPython Notebook), and R tools.  Day 3 was dedicated to the web stack, and visualization via ESRI Online, CartoDB, and Leaflet. Web mapping is great, and as OpenGeo.org says: “Internet maps appear magical: portals into infinitely large, infinitely deep pools of data. But they aren't magical, they are built of a few standard pieces of technology, and the pieces can be re-arranged and sourced from different places.…Anyone can build an internet map."

All-in-all it was a great time spent with a collection of very interesting mapping professionals from around the country. Thanks to everyone!

Friday
Mar252016

It's AAG time again!

The annual AAG conference is rolling into town next week, and several of us will be there. 

  • Kelly and Jenny will be presenting; 
    • Kelly: Disentangling drivers of change in California Forests: management and climate 
    • Jenny: Spatial Data Science for Collaborative Geospatial Research
  • Alice is a discussant on THREE panels; and 
  • I am a discussant on the Historical Ecology session. 

Former kellylabbers will also be in force: 

  • John Connors is presenting (and organizing, and morderating, and all kinds of things): 
    • Disentangling Diversity: Agrobiodiversity, Livelihoods, and Food Security in the Kilombero Valley, Tanzania
  • Desheng Liu will be there: 
    • Reconstructing Land Cover Trajectories from Dense MODIS Time Series
  • Ellen Kersten will be presenting:
    • Got health? Using spatial and temporal analysis to achieve health equity for children 

 Have a great time everyone! (If I have missed anyone, let me know!)

Friday
Jan152016

ESRI @ GIF Open GeoDev Hacker Lab

We had a great day today exploring ESRI open tools in the GIF. ESRI is interested in incorporating more open tools into the GIS workflow. According to www.esri.com/software/open, this means working with:

  1. Open Standards: OGC, etc. 
  2. Open Data formats: supporting open data standards, geojson, etc. 
  3. Open Systems: open APIs, etc. 

We had a full class of 30 participants, and two great ESRI instructors (leaders? evangelists?) John Garvois and Allan Laframboise, and we worked through a range of great online mapping (data, design, analysis, and 3D) examples in the morning, and focused on using ESRI Leaflet API in the afternoon. Here are some of the key resources out there.

Great Stuff! Thanks Allan and John

Tuesday
Jan122016

Spatial Data Science Bootcamp March 2016

Register now for the March 2016 Spatial Data Science Bootcamp at UC Berkeley!

We live in a world where the importance and availability of spatial data are ever increasing. Today’s marketplace needs trained spatial data analysts who can:

  • compile disparate data from multiple sources;
  • use easily available and open technology for robust data analysis, sharing, and publication;
  • apply core spatial analysis methods;
  • and utilize visualization tools to communicate with project managers, the public, and other stakeholders.

To help meet this demand, International and Executive Programs (IEP) and the Geospatial Innovation Facility (GIF) are hosting a 3-day intensive Bootcamp on Spatial Data Science on March 23-25, 2016 at UC Berkeley.

With this Spatial Data Science Bootcamp for professionals, you will learn how to integrate modern Spatial Data Science techniques into your workflow through hands-on exercises that leverage today's latest open source and cloud/web-based technologies. We look forward to seeing you here!

To apply and for more information, please visit the Spatial Data Science Bootcamp website.

Limited space available. Application due on February 19th, 2016.

Monday
Nov302015

GIS Day Wrap Up (a bit late...)

GIS Day 2015! Happy 10th Birthday to the GIF! 

Panel of mapping innovators @ GIS Day 2015

A quick look at the past decade:

The GIF began in November 2015 on a wave of excitement around geospatial technology. In the months leading up to our first GIS Day in 2005, Google Maps launched, then went mobile; Google Earth launched in the summer; and NASA Blue Marble arrived. Hurricane Katrina changed the way we map disasters in real time. The opening up of the Landsat archive at no-cost by the USGS revolutionized how we can monitor the Earth's surface by allowing dense time-series analysis. These and other developments made viewing our world with detail, ease, and beauty commonplace, but these were nothing short of revolutionary - spurring new developments in science, governance and business. The decade since then has been one of intense innovation, and we have seen a rush in geospatial technologies that have enriched our lives immeasurably.

As 2015 ends we can recognize a similar wave of excitement around geospatial technology as we experienced a decade ago, yet one that is more diverse and far reaching than in 2005. This GIS Day we sought to highlight the societal benefit derived from innovators across academia, non-profits, government, and industry. 

GIS Day/GIF 10th Anniversary

On November 18 we co-hosted GIS Day with BayGeo (formerly BAAMA) as we have in the past and had well over 180 attendees. Our GIS Day featured posters, lightening talks, presentations, and a panel session that included local innovators from Bay Area Industry, Government, and Non-Profits. Our panel speakers included: Cindy Schmidt (NASA); Gregory Crutsinger (3D Robotics); Karin Tuxen-Bettman (Google); Ken-ichi Ueda (iNaturalist); Sara Dean (Stamen Designs); Jeffrey Miller (GeoWing); and Kyle Brazil (Urthecast). The discussion included what skills they look for in recruiting and where they see the geospatial world going in the next 5 years. It was a fun evening and personally, I learned a ton. Many levels of appreciation go out to those who spoke, those who came, and those who helped make the day happen. 

Friday
Nov132015

California Economic Summit wrap-up

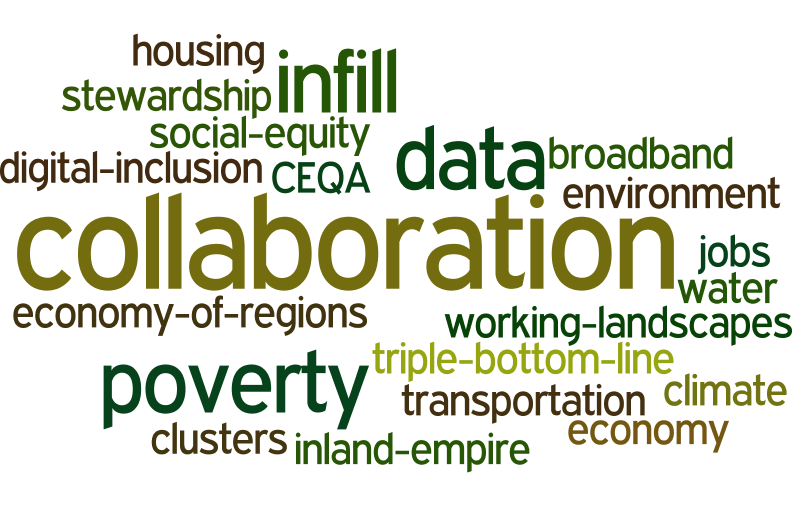
my wordle cloud on topics commonly discussed at the summit

I spent two days at the California Economic Summit, held this year in Ontario, heart of the "inland empire". I learned much about this region of the state that I know mostly as freeways connecting water polo games, or as endless similar roads through malls and housing developments. It is more populous, diverse, and vibrant than I had realized. The conference itself was very different from any that I have been to. Hardly any presentations, but break-out groups, passionate, inspiring panelists, tons of networking, good overviews, multiple perspectives, and no partisanship.

Here are some interesting facts about California that I did not know: 

  • 80% of CEQA lawsuits are related to urban infill development. Shocking. We need infill development as a sensible solution to a growing California. 
  • 1 in 3 children in the Central Valley live in poverty. 1 in 4 kids live in poverty in the inland empire. These rates are WORSE than they have been ever. 
  • The Bay Area is an anomaly in terms of education, income, health, voting rates, broadband adoption. The Bay Area is not representative of the state!
  • Think of a west-east line drawn across the state to demark the population halfway line. Where might it be? No surprise it is moving south. Now it runs almost along Wilshire Blvd in LA!
  • Empowering the Latino community in the state is going to be key in continued success. 
  • Broadband adoption around the state is highly variable: Latino, poor and disabled communities are far below other communities in terms of adoption. 
  • The first beer made with recyled water has been made by Maverick's Brewing Company. 
  • Dragon Fruit might be the new water-wise avocado. Good anti-oxidents, massive vitamin C, good fiber, etc. They taste a bit like a less sweet kiwi, with a bit of texture from the seeds. I don't think I'd like the quac, however. 
  • In 15 years, the state will be in a deficit of college graduates needed to meet skilled jobs. Those 2030 graduates are in 1st grade now, so we can do some planning. 
  • Access, affordability, and attainability are the cornerstones of our great UC system. 

In every session I attended I heard about the need for, and lack of collaboration between agencies, entities, people, in order to make our future better. Here is my wordle cloud of discussion topics, from my biased perspective, or course. 

Saturday
Jun062015

Spatial Data Science @ Berkeley May 2015

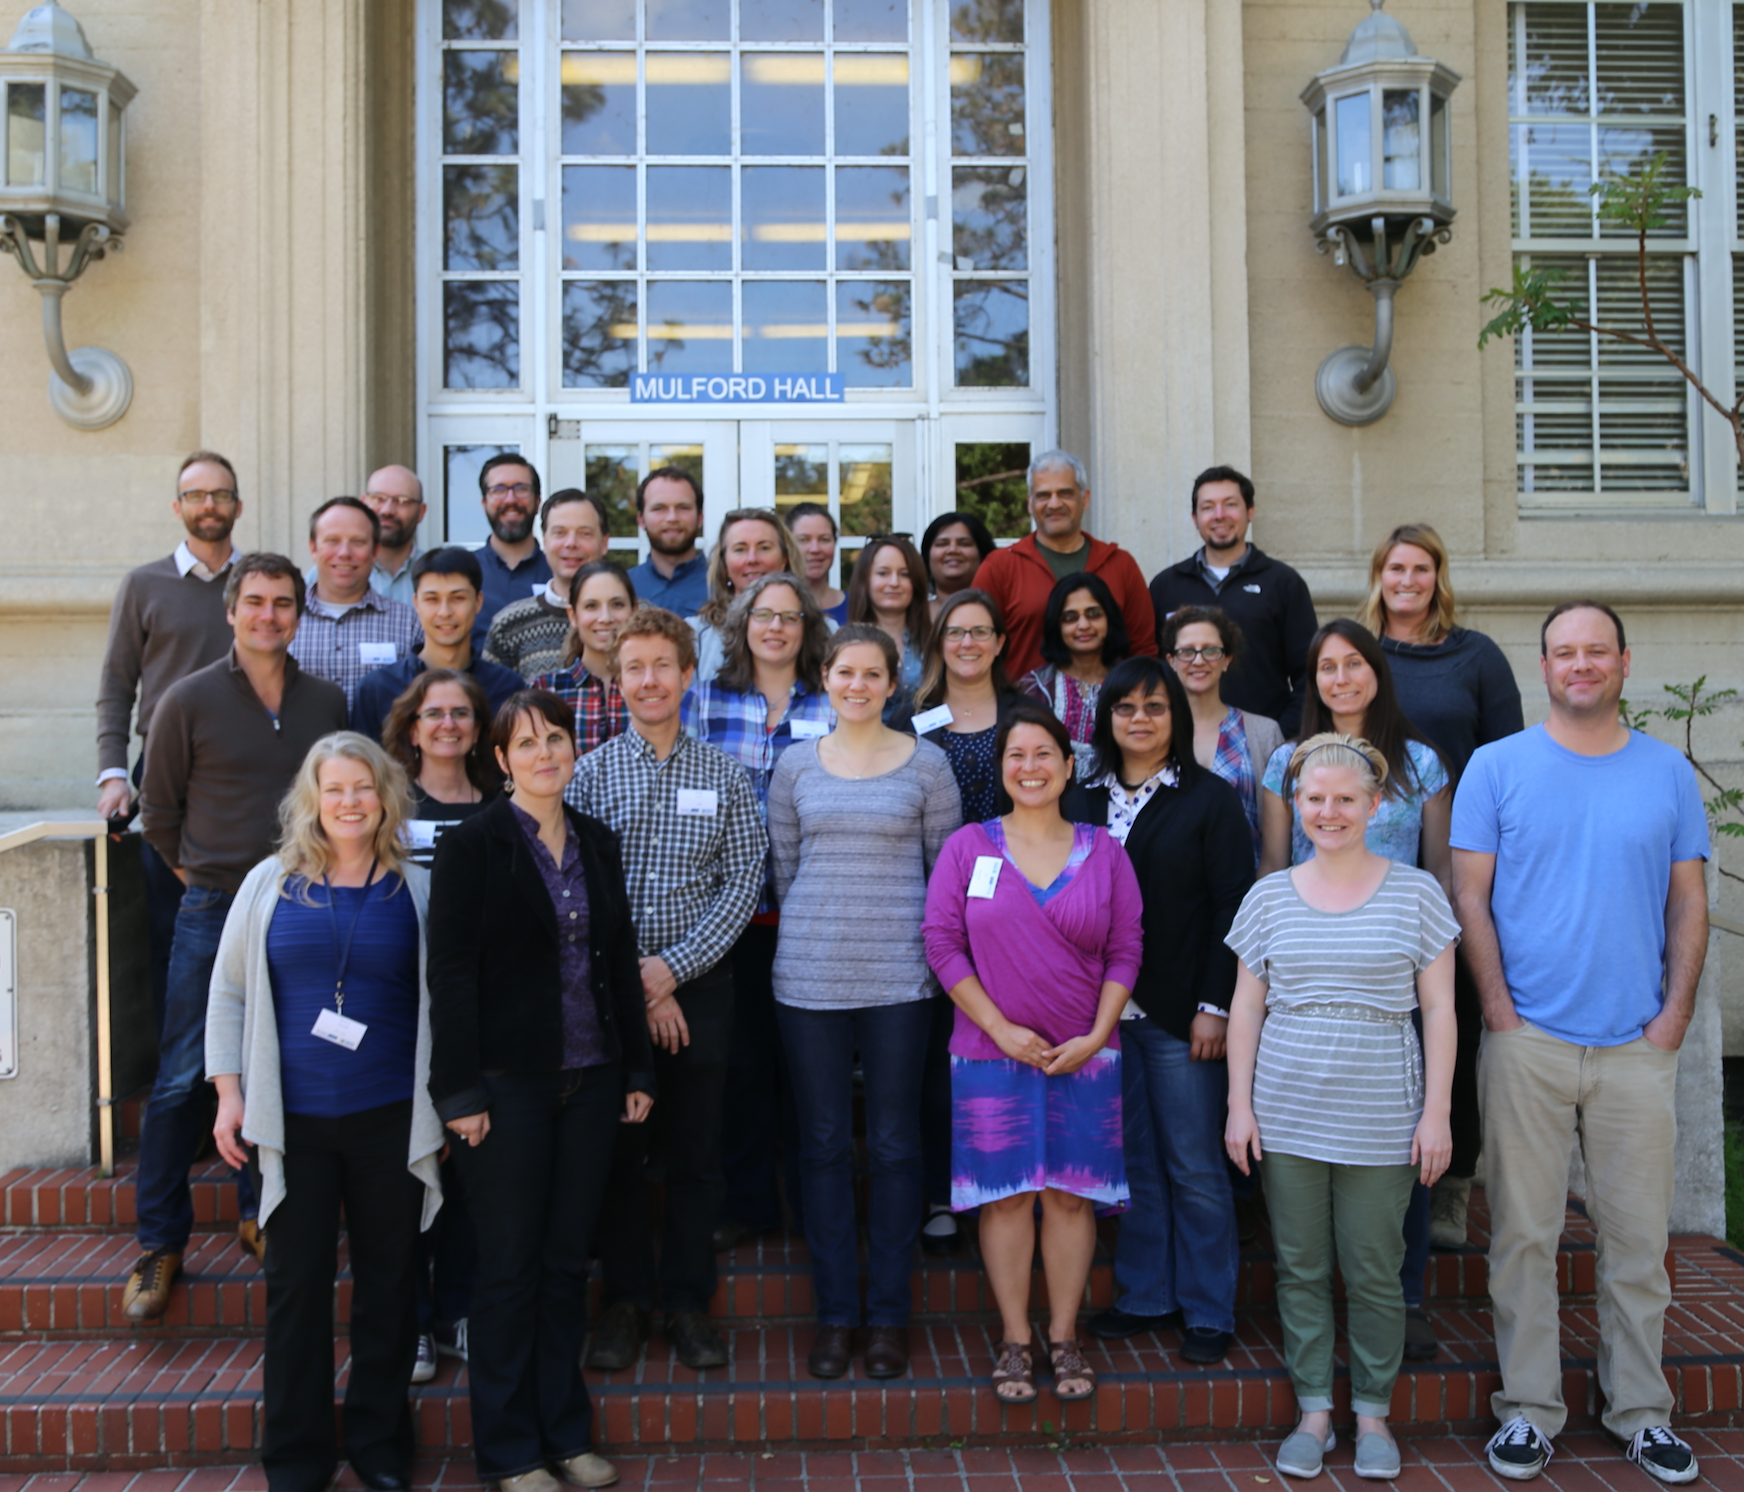
Bootcamp participants outside historic Mulford HallOur bootcamp on Spatial Data Science has concluded. We had three packed days learning about the concepts, tools and workflow associated with spatial databases, analysis and visualizations. 

Our goal was not to teach a specific suite of tools but rather to teach participants how to develop and refine repeatable and testable workflows for spatial data using common standard programming practices.

On Day 1 we focused on setting up a collaborative virtual data environment through virtual machines, spatial databases (PostgreSQL/PostGIS) with multi-user editing and versioning (GeoGig). We also talked about open data and open standards, and modern data formats and tools (GeoJSON, GDAL).

Analyzing spatial data is the best part! On Day 2 we focused on open analytical tools for spatial data. We focused on one particular class of spatial data analysis: pattern analysis, and used Python (i.e. PySAL, NumPy, PyCharm, iPython Notebook), and R Studio (i.e. raster, sp, maptools, rgdal, shiny) to look at spatial autocorrelation and spatial regression. 

Wait, visualizing spatial data is the best part! Day 3 was dedicated to the web stack, and visualization. We started with web mapping (web stack, HTML/CSS, JavaScript, Leaflet), and then focused on web-based visualizations (D3).  Web mapping is great, and as OpenGeo.org says: “Internet maps appear magical: portals into infinitely large, infinitely deep pools of data. But they aren't magical, they are built of a few standard pieces of technology, and the pieces can be re-arranged and sourced from different places.…Anyone can build an internet map."

All-in-all it was a great time spent with a collection of very interesting mapping professionals from around the country (and Haiti!). Thanks to everyone!