blog authors
past blog entries

Welcome to the Kellylab blog

geospatial matters

Please read the UC Berkeley Computer Use Policy. Only members can post comments on this blog.

Entries in tools (31)

Friday
Oct092015

rOpenSci- new R package to search biodiversity data

Awesome new (ish?) R package from the gang over at rOpenSci 

Tired of searching biodiversity occurance data through individual platforms? The "spocc" package comes to your rescue and allows for a streamlined workflow in the collection and mapping of species occurrence data from range of sites including: GBIF, iNaturalist, Ecoengine, AntWeb, eBird, and USGS's BISON.

There is a caveat however, since the sites use alot of the same repositories the authors of the package caution to check for dulicates. Regardless what a great way to simplify your workflow!

Find the package from CRAN: install.packages("spocc") and read more about it here!

Saturday
Apr052014

Sierra Nevada Decision Support System

Former student and GIS expert Chippie Kislik alerted me to this video. She is working with others at NASA Ames on a Sierra Nevada DSS Ecological Forecasting Project. A video about the project is here.

The Sierra Nevada contains vital ecosystems that are experiencing changes in hydrologic regimes, such as decreases in snowmelt and peak runoff, which affect forest health and water resources. Currently, the U.S. Forest Service Region 5 office is undergoing Forest Plan revisions to integrate climate-change impacts into mitigation and adaptation strategies. However, there are few tools in place to conduct quantitative assessments of forest and surface conditions in relation to mountain hydrology, while easily and effectively delivering that information to forest managers. To assist the Forest Service, this research team created a Decision Support System (DSS) featuring data integration, data viewing, reporting, and forecasting of ecological conditions within all Sierra Nevada intersecting watersheds.

Thursday
Feb132014

Clark Labs to Create Cloud-based Land Change Modeler for ArcGIS

Clark Labs was awarded a million dollar grant from Esri to create a cloud-based version of their Land Change Modeler for ArcGIS. Land Change Modeler is suite of tools to assess and predict land change and evaluate the impacts of change and includes REDD (Reducing Emissions from Deforestation and Forest Degradation) tools for modeling the impact of land cover change on carbon emissions. Currently Land Change Modeler is only available in IDRISI and as a software extension for ArcGIS (the latest version is compatible with v10.2). This will make this tool more easily assessable to the wider public and scientific community.

From Clark Labs press release:

"Clark Labs was recently awarded a million dollar grant from Esri to create a cloud-based version of their Land Change Modeler for ArcGIS. Currently, Clark Labs’ extension is for the ArcGIS desktop.

Land Change Modeler for ArcGIS, first released in 2007 with Version 2 released this past month, is a software extension for ArcGIS users, offering a suite of tools to assess and predict land change and evaluate the impacts of such change. Clark Labs recent release includes many significant enhancements. The new version is compatible with ArcGIS Version 10.2

The Land Change Modeler offers an extensive suite of tools for land change research in a simple and automated workflow. It provides a variety of tools for land change analysis and prediction, as well as the impacts of those changes.

The new version release of this fall provides significant enhancements, particularly for its utility for REDD (Reducing Emissions from Deforestation and Forest Degradation). Land Change Modeler now includes functionality for modeling the impact of land cover change on carbon emissions. “Our world is changing rapidly, and technology to efficiently model and predict future land change is vital to addressing global challenges,’ said Jack Dangermond, Esri President. “We’re pleased to award this grant to Clark Labs to jumpstart their effort to utilize and provide rich content through ArcGIS Online.”

The new version also provides more capability for estimating land change impacts on habitat and biodiversity. With the grant from Esri, Clark Labs will be creating a cloud-based implementation of Land Change Modeler for their platform.

Clark Labs and Esri have been business partners for nearly ten years, working collaboratively on GIS research."

For the full news release see here.

Friday
Jul192013

Hey OakMappers! Updated OakMapper available for iPhones and iPads

The new OakMapper logo

We are excited to announce the new version (2.3) of the OakMapper iPhone/iPad App, available to download now for free at the iTunes App Store [link].

In this version of the OakMapper App, the original browse and search functionalities have been retooled to improve the user interface design and user interaction. A new user can sign up for a new OakMapper account directly using the App. Users who has logged into their account can manage their profile, change their password, and submit a SOD point. The submission process has been re-engineered to achieve a better and more intuitive submission workflow. Users can also take a picture of a suspected SOD infected tree and upload it right from their iOS devices.

To explore all the new features of the OakMapper iPhone/iPad App, please install OakMapper from the iTunes App Store [link] now. Please feel free to share this App with your friends. If you like the OakMapper app, please rate the app and leave your comments in the App store. If you should have any questions, please email us at oakmapper@gmail.com.

Enjoy!

OakMapper
Shufei Lei, Web/Mobile App Developer
Maggi Kelly, Principal Investigator
www.oakmapper.org

Wednesday
Jan302013

Mapping and interactive projections with D3

D3 is a javascript library that brings data to life through an unending array of vizualizations.  Whether you've realized it or not, D3 has been driving many of the most compeling data visualizations that you have likely seen throughout the last year including a popular series of election tracking tools in the New York Times.

You can find a series of examples in D3's gallery that will keep you busy for hours!

In addition to the fantastic charting tools, D3 also enables a growing list of mapping capabilities.  It is really exciting to see where all this is heading.  D3's developers have been spending a lot of time most recently working on projections transformations.  Check out these amazing interactive projection examples:

Projection Transitions

Comparing Map Projections

Adaptive Composite Map Projections (be sure to use chrome for the text to display correctly)

Can't wait to see what the future has in store for bringng custom map projections to life in more web map applications!


Wednesday
Oct102012

ESRI MODIS Toolbox

Cool MODIS NDVI tool pointed out to us from Jenny P.

This toolbox contains scripts that download NASA satellite imagery from MODIS and import it into ArcMap. The four data products currently supported are: evapotranspiration, land surface temperature, normalized difference vegetation index (NDVI), and enhanced vegetation index (EVI).

These products are available for the entire surface of the Earth at 1 km resolution and for any month going back to January 2000, when MODIS first launched aboard the satellite Terra.

http://resources.arcgis.com/gallery/file/geoprocessing/details?entryID=9CC382D2-1422-2418-34F8-DC9F97B24052

Tuesday
Oct022012

CartoDB launches tools for visualizing temporal data

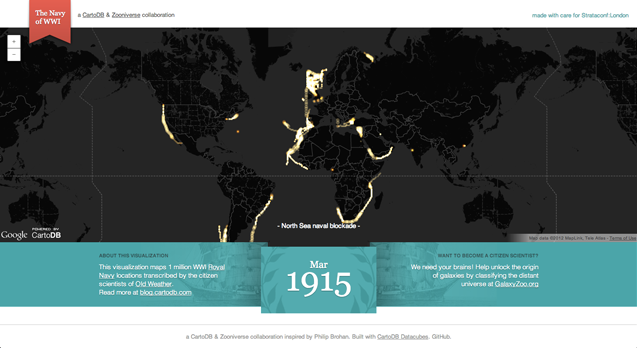
CartoDB, a robust and easy to use web mapping application, today launched "torque" a new feature enabling visualization of temporal data sets. 

From the CartoDB team:

Torque is a library for CartoDB that allows you to create beautiful visualizations with temporal datasets by bundling HTML5 browser rendering technologies with an efficient data transfer format using the CartoDB API. You can see an example of Torque in action on the Guardian's Data Blog, and grab the open source code from here.

Be sure to check out the example based on location data recorded from Captain's logs from the British Royal Navy during the first World War.  Amazing stuff!


Friday
Jun222012

New ArcGIS and QGIS desktop versions available

Big updates are now available to both ArcGIS and QGIS bringing more power and functionality to desktop GIS users!

ArcGIS 10.1 is now available with lots of new features.  Learn more from ESRI.com.  The GIF is now testing the updated software and we plan to make it available on lab workstations in the coming weeks.

QGIS 1.8 is also now available, and is free for download.  Visit QGIS.org for download instructions and to learn more about the new features available in this release.

Wednesday
Jun132012

New software to extract geographically representative images from Google Street View

New software developed by Carnegie Mellon University in Pittsburgh and INRIA in Paris mines the geotagged imagery in Google Street View to uncover what architectural features distinguish one city from another across the globe. The software is based upon a discriminative clustering algorithm to distinguish features in one picture from another. This research shows that geographically representative image elements can be discovered automatically from Google Street View imagery in a discriminative manner.

Jacob Aron from the New Scientist reports:

"The researchers selected 12 cities from across the globe and analysed 10,000 Google Street View images from each. Their algorithm searches for visual features that appear often in one location but infrequently elsewhere...It turns out that ornate windows and balconies, along with unique blue-and-green street signs, characterise Paris, while columned doorways, Victorian windows and cast-iron railings mark London out from the rest. In the US, long staircases and bay windows mean San Francisco, and gas-powered street lamps are scattered throughout Boston."

"The discovered visual elements can also support a variety of computational geography tasks, such as mapping architectural correspondences and influences within and across cities, finding representative elements at different geo-spatial scales, and geographically-informed image retrieval."

Read the full story by clicking here.

To read the research paper and view the project website click here.

Wednesday
Feb292012

New OSGeo-Live GIS software collection released

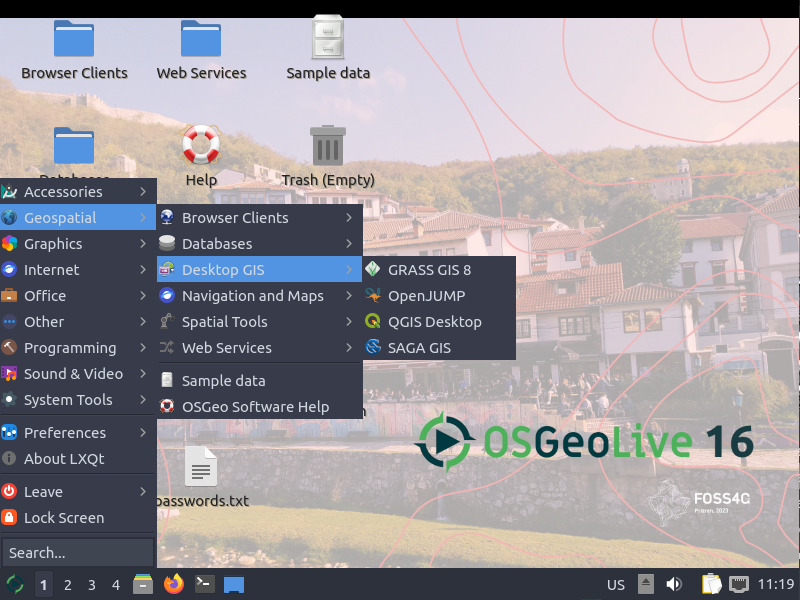
OSGeo-Live is a self-contained bootable DVD, USB flash drive and Virtual Machine based upon Ubuntu Linux that is pre-configured with a wide variety of robust open source geospatial software. The applications can be trialled without installing anything on your computer, simply by booting the computer from the DVD or USB drive. The lightening overview introduces all these applications, and hence provides a comprehensive introduction to the breadth of Geospatial Open Source.

http://live.osgeo.org

Highlights
50 Quality Geospatial Open Source applications installed and pre-configured
Quality free world maps and geodata
One page overviews and quick start guides for all applications
Overviews of key OGC standards
Translations for Greek, German, Polish, Spanish and Japanese

Contents

Browser Clients

  • OpenLayers - Browser GIS Client
  • Geomajas - Browser GIS Client
  • Mapbender - Geoportal Framework
  • MapFish - Web Mapping Framework
  • GeoMoose - Web GIS Portal

Crisis Management

  • Sahana Eden - Disaster management
  • Ushahidi - Mapping and Timeline for events

Databases

  • PostGIS - Spatial Database
  • SpatiaLite - Lightweight Database
  • Rasdaman - Multi-Dimensional Raster Database
  • pgRouting - Routing for PostGIS


Desktop GIS

  • Quantum GIS (QGIS)
  • GRASS GIS
  • gvSIG Desktop
  • User-friendly Desktop Internet GIS (uDig)
  • Kosmo Desktop
  • OpenJUMP GIS
  • SAGA
  • OSSIM - Image Processing
  • Geopublisher - Catalogue
  • AtlasStyler - Style Editor
  • osgEarth - 3D Terrain Rendering
  • MB-System - Sea Floor Mapping

Navigation and Maps

  • GpsDrive - GPS Navigation
  • Marble - Spinning Globe
  • OpenCPN - Marine GPS Chartplotter
  • OpenStreetMap - OpenStreetMap Tools
  • Prune - View, Edit and Convert GPS Tracks
  • Viking - GPS Data Analysis and Viewer
  • zyGrib - Weather Forecast Maps


Spatial Tools

  • GeoKettle - ETL (Extract, Transform and Load) Tool
  • GDAL/OGR - Geospatial Data Translation Tools
  • GMT - Cartographic Rendering
  • Mapnik - Cartographic Rendering
  • MapTiler - Create Map Tiles
  • OTB - Image Processing
  • R Spatial Task View - Statistical Programming


Web Services

  • GeoServer
  • MapServer
  • deegree
  • GeoNetwork - Metadata Catalogue
  • pycsw - Metadata Catalogue
  • MapProxy - Proxy WMS & tile services
  • QGIS Server - Web Map Service
  • 52°North WSS - Web Security Service
  • 52°North WPS - Web Processing Service
  • 52°North SOS - Sensor Observation Service
  • TinyOWS - WFS-T Service
  • ZOO Project - Web Processing Service


Data

  • Natural Earth - Geographic Data Sets
  • OSGeo North Carolina, USA Educational dataset
  • OpenStreetMap - Sample extract from OpenStreetMap


Geospatial Libraries

  • GeoTools - Java GIS Toolkit
  • MetaCRS - Coordinate Reference System Transformations
  • libLAS - LiDAR Data Access


Other software of interest (not available Live)

  • MapWindow GIS - Microsoft Windows based GIS
  • MapGuide Open Source - Web Service