blog authors
past blog entries

Welcome to the Kellylab blog

geospatial matters

Please read the UC Berkeley Computer Use Policy. Only members can post comments on this blog.

Entries by Kevin (24)

Wednesday
Nov272013

Happy Thanksgiving everyone! version 2013

Range map of our friend Meleagris gallopovaThe ancestor all present-day gobblers—Meleagris gallopova - ranged from southeastern Canada to Mexico. 

Our present-day wild turkey has a loud call, with descending gobbles, and a variety of clucking notes. He struts through open woodlands, oaks, edges, and the occasional suburb.

The Wild Turkey’s popularity at the table led to a drastic decline in numbers, but they have recovered and now occur in every state except Alaska.

I think Ben Franklin said it best, in comparing the turkey to the eagle:

For in Truth the Turk'y is in comparison a much more respectable bird, and withal a true original native of America.... He is, (though a little vain and silly, it is true, but not the worse emblem for that,) a Bird of Courage, and would not hesitate to attack a grenadier of the British Guards, who should presume to invade his Farm Yard with a red Coat on.

Happy Thanksgiving Everyone!

Information from A Short History of the Turkey by the Collonial Williamsburg Newsletter, and BirdFellow.com.

Wednesday
Jan302013

Mapping and interactive projections with D3

D3 is a javascript library that brings data to life through an unending array of vizualizations.  Whether you've realized it or not, D3 has been driving many of the most compeling data visualizations that you have likely seen throughout the last year including a popular series of election tracking tools in the New York Times.

You can find a series of examples in D3's gallery that will keep you busy for hours!

In addition to the fantastic charting tools, D3 also enables a growing list of mapping capabilities.  It is really exciting to see where all this is heading.  D3's developers have been spending a lot of time most recently working on projections transformations.  Check out these amazing interactive projection examples:

Projection Transitions

Comparing Map Projections

Adaptive Composite Map Projections (be sure to use chrome for the text to display correctly)

Can't wait to see what the future has in store for bringng custom map projections to life in more web map applications!


Tuesday
Oct022012

CartoDB launches tools for visualizing temporal data

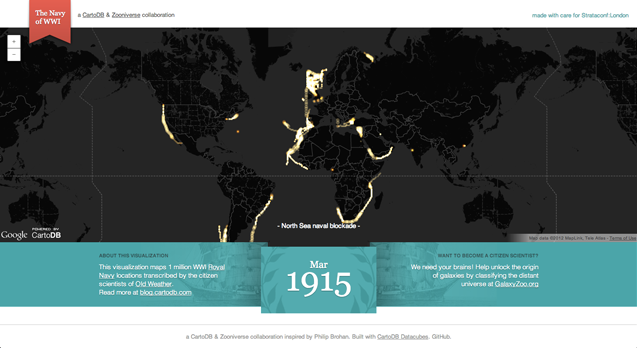
CartoDB, a robust and easy to use web mapping application, today launched "torque" a new feature enabling visualization of temporal data sets. 

From the CartoDB team:

Torque is a library for CartoDB that allows you to create beautiful visualizations with temporal datasets by bundling HTML5 browser rendering technologies with an efficient data transfer format using the CartoDB API. You can see an example of Torque in action on the Guardian's Data Blog, and grab the open source code from here.

Be sure to check out the example based on location data recorded from Captain's logs from the British Royal Navy during the first World War.  Amazing stuff!


Friday
Aug312012

Bing Maps completes Global Ortho project for US

The Bing Maps team has anounced the completion of the Global Ortho Project for the US.  The project provides 30cm resolution imagery for the entire US, all acquired within the last 2 years.  You can access all of the imagery now through Bing Maps, it is pretty amazing to see such detail for all of the far off places that typically don't get high resolution attention. 

Find out more about the project from the Bing Maps Blog, or view the data for yourself.

Friday
Jun222012

New ArcGIS and QGIS desktop versions available

Big updates are now available to both ArcGIS and QGIS bringing more power and functionality to desktop GIS users!

ArcGIS 10.1 is now available with lots of new features.  Learn more from ESRI.com.  The GIF is now testing the updated software and we plan to make it available on lab workstations in the coming weeks.

QGIS 1.8 is also now available, and is free for download.  Visit QGIS.org for download instructions and to learn more about the new features available in this release.

Wednesday
Feb292012

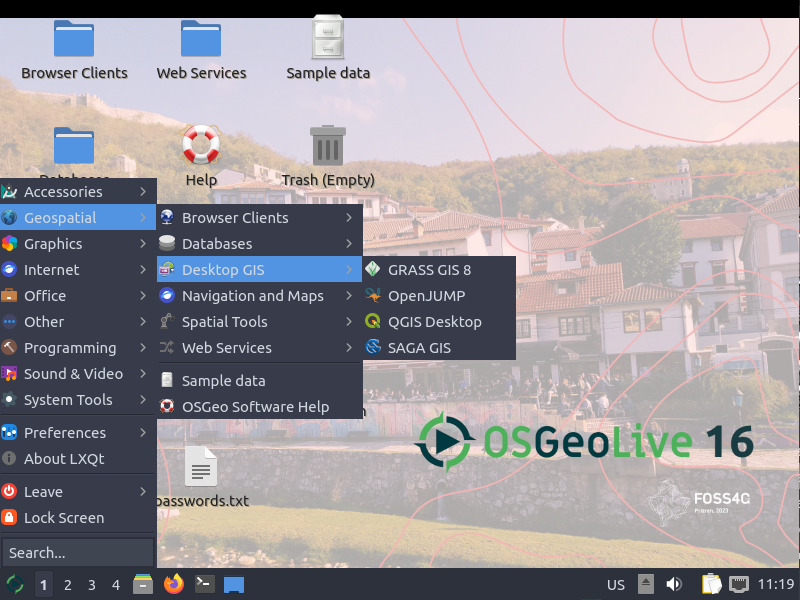
New OSGeo-Live GIS software collection released

OSGeo-Live is a self-contained bootable DVD, USB flash drive and Virtual Machine based upon Ubuntu Linux that is pre-configured with a wide variety of robust open source geospatial software. The applications can be trialled without installing anything on your computer, simply by booting the computer from the DVD or USB drive. The lightening overview introduces all these applications, and hence provides a comprehensive introduction to the breadth of Geospatial Open Source.

http://live.osgeo.org

Highlights
50 Quality Geospatial Open Source applications installed and pre-configured
Quality free world maps and geodata
One page overviews and quick start guides for all applications
Overviews of key OGC standards
Translations for Greek, German, Polish, Spanish and Japanese

Contents

Browser Clients

  • OpenLayers - Browser GIS Client
  • Geomajas - Browser GIS Client
  • Mapbender - Geoportal Framework
  • MapFish - Web Mapping Framework
  • GeoMoose - Web GIS Portal

Crisis Management

  • Sahana Eden - Disaster management
  • Ushahidi - Mapping and Timeline for events

Databases

  • PostGIS - Spatial Database
  • SpatiaLite - Lightweight Database
  • Rasdaman - Multi-Dimensional Raster Database
  • pgRouting - Routing for PostGIS


Desktop GIS

  • Quantum GIS (QGIS)
  • GRASS GIS
  • gvSIG Desktop
  • User-friendly Desktop Internet GIS (uDig)
  • Kosmo Desktop
  • OpenJUMP GIS
  • SAGA
  • OSSIM - Image Processing
  • Geopublisher - Catalogue
  • AtlasStyler - Style Editor
  • osgEarth - 3D Terrain Rendering
  • MB-System - Sea Floor Mapping

Navigation and Maps

  • GpsDrive - GPS Navigation
  • Marble - Spinning Globe
  • OpenCPN - Marine GPS Chartplotter
  • OpenStreetMap - OpenStreetMap Tools
  • Prune - View, Edit and Convert GPS Tracks
  • Viking - GPS Data Analysis and Viewer
  • zyGrib - Weather Forecast Maps


Spatial Tools

  • GeoKettle - ETL (Extract, Transform and Load) Tool
  • GDAL/OGR - Geospatial Data Translation Tools
  • GMT - Cartographic Rendering
  • Mapnik - Cartographic Rendering
  • MapTiler - Create Map Tiles
  • OTB - Image Processing
  • R Spatial Task View - Statistical Programming


Web Services

  • GeoServer
  • MapServer
  • deegree
  • GeoNetwork - Metadata Catalogue
  • pycsw - Metadata Catalogue
  • MapProxy - Proxy WMS & tile services
  • QGIS Server - Web Map Service
  • 52°North WSS - Web Security Service
  • 52°North WPS - Web Processing Service
  • 52°North SOS - Sensor Observation Service
  • TinyOWS - WFS-T Service
  • ZOO Project - Web Processing Service


Data

  • Natural Earth - Geographic Data Sets
  • OSGeo North Carolina, USA Educational dataset
  • OpenStreetMap - Sample extract from OpenStreetMap


Geospatial Libraries

  • GeoTools - Java GIS Toolkit
  • MetaCRS - Coordinate Reference System Transformations
  • libLAS - LiDAR Data Access


Other software of interest (not available Live)

  • MapWindow GIS - Microsoft Windows based GIS
  • MapGuide Open Source - Web Service
Monday
Oct312011

Cal-Adapt featured on SmartPlanet

Smartplanet recently produced a video featuring Cal-Adapt.  See it here!

At UC Berkeley's Geospatial Innovation Facility software developers are building a Web-based mapping tool to help scientists prepare for the changing climate conditions in California. The team has culled data from various climate research organizations to get projection data of what different climates might look like over a 150-year period. SmartPlanet visits the lab to see a demo of how the tool works.

Friday
Oct282011

3D Street level mapping with earthmine


earthmine's Anthony Fassero visited yesterday to give a Geolunch presentation and blew us away with the amazing technology that they are employing!  Anthony, and Co-Founder John Ristevski started earthmine just a few years ago after graduating from Cal. 

earthmine has developed the camera system and engineering to take high resolution 3d street level images using only photogrammetric techniques (no lidar), as well as software tools that allow users to work with the data directly in ArcGIS and other geospatial applications. These tools allow you to not only view the data alongside a map, but to actualy make 3d measurements one the fly and edit ancillary data layers from within the phot view.

You have to see it for yourself!  Check out this video to see teh data and tools in action.

Tuesday
Aug302011

Animal tracking with "Smart Collars"

There is an interesting arcticle in today's New York Times about the use of a new breed of animal tracking collars that use on board computers to track valuable information about an animal, beyond location alone.  The new "smart collars" can be used to track when an animal is sleeping, when it is feeding, and lots of other metrics.  The additional data being gathered gives biologists more information to work with while trying to understand the animals habits and needs, in order to provide informed wildlife management decisons.

Wednesday
Jul132011

Geo-Immersion Makes Maps Come Alive

Very cool application developed at USC.  Geo-Immersion adds realtime video and data feeds to map of USC campus.  Check out the article from NSF's Science Nation, and the video below.