CartoDB launches tools for visualizing temporal data
 Tuesday, October 2, 2012 at 10:03AM
 CartoDB, a robust and easy to use web mapping application, today launched "torque" a new feature enabling visualization of temporal data sets.
From the CartoDB team:
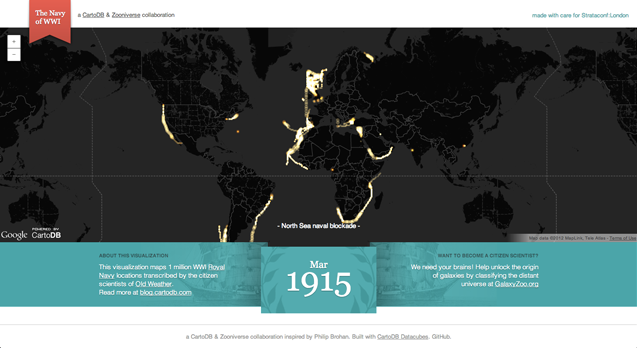
Torque is a library for CartoDB that allows you to create beautiful visualizations with temporal datasets by bundling HTML5 browser rendering technologies with an efficient data transfer format using the CartoDB API. You can see an example of Torque in action on the Guardian's Data Blog, and grab the open source code from here.
Be sure to check out the example based on location data recorded from Captain's logs from the British Royal Navy during the first World War. Amazing stuff!
 Kevin | in
  new software,
  open source,
  tools,
  viz,
viz,  webgis |

Reader Comments