blog authors
past blog entries

Welcome to the Kellylab blog

geospatial matters

Please read the UC Berkeley Computer Use Policy. Only members can post comments on this blog.

Entries in remote sensing (167)

Tuesday
Apr192016

Wall-E was right

Landsats - active and decommissioned

Used in my MDP lecture today, and so posting so I can find it easily later! 

http://apps.agi.com/SatelliteViewer/

Great web app for viewing current satellite orbits.

More detailed info here:  http://qz.com/296941/interactive-graphic-every-active-satellite-orbiting-earth/

Friday
Apr012016

ASTER Data Open - No April Fools!

We know about the amazing success for science, education, government, and business that has resulted from the opening of the Landsat archive in 2008. Now more encouraging news about open data:

On April 1, 2016, NASA's Land Processes Distributed Active Archive Center (LP DAAC) began distributing ASTER Level 1 Precision Terrain Corrected Registered At-Sensor Radiance (AST_L1T) data products over the entire globe at no charge. Global distribution of these data at no charge is a result of a policy change made by NASA and Japan.

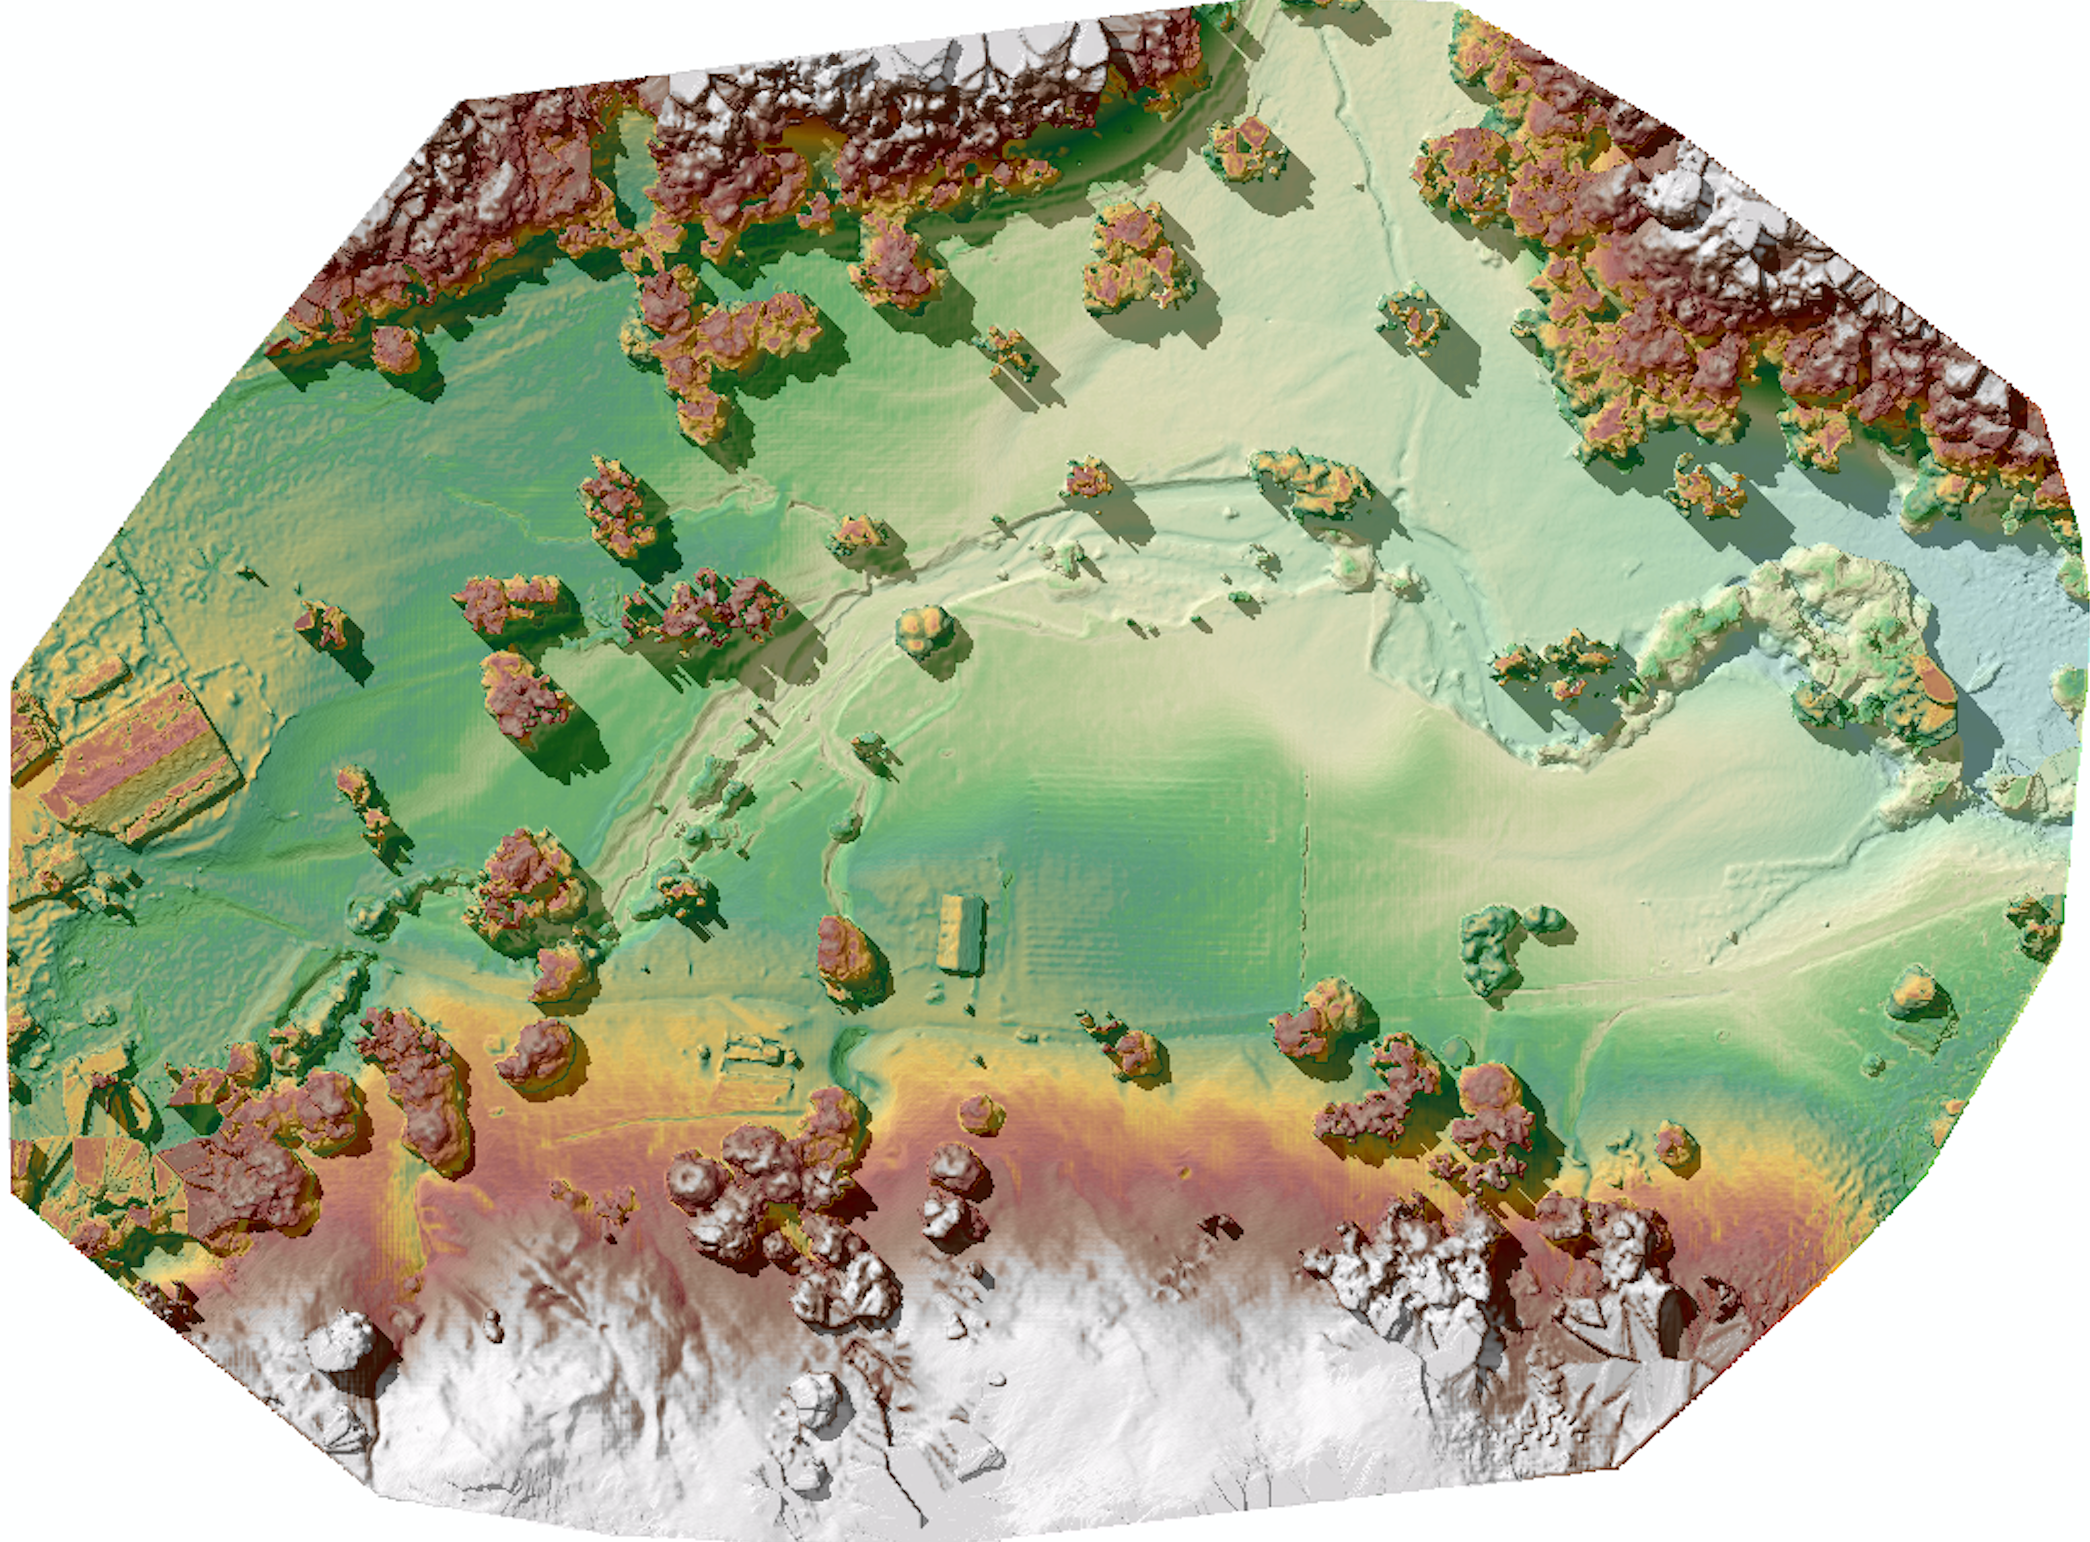
The AST_L1T product provides a quick turn-around of consistent GIS-ready data as a multi-file product, which includes a HDF-EOS data file, full-resolution composite images (FRI) as GeoTIFFs for tasked telescopes (e.g., VNIR/SWIR and TIR ), and associated metadata files. In addition, each AST_L1T granule contains related products including low-resolution browse and, when applicable, a Quality Assurance (QA) browse and QA text report.

More than 2.95 million scenes of archived data are now available for direct download through the LP DAAC Data Pool and for search and download through NASA‘s Earthdata Search Client and also through USGS‘ GloVis , and USGS‘ EarthExplorer . New scenes will be added as they are acquired and archived.

ASTER is a partnership between NASA, Japan‘s Ministry of Economy, Trade and Industry (METI), the National Institute of Advanced Industrial Science and Technology (AIST) in Japan, and Japan Space Systems (J-spacesystems ).

Visit the LP DAAC ASTER Policy Change Page to learn more about ASTER. Subscribe to the LP DAAC listserv for future announcements.

Tuesday
Mar082016

IGIS exploring applications of drones for UC Agriculture and Natural Resources

IGIS is excited to be working with 3D Robotics (3DR) to explore new applications of small unmanned aerial systems (sUAS) for monitoring agriculture and natural resources.  This technology has never been more practical for scientific exploration; however, there is still much to be learned about how to best utilize sUAS in this way.

DEM from drone flightIGIS is now developing protocols for safe and efficient deployment of a 3DR Solo sUAS.  Equipped with a common 12 megapixel GoPro Hero camera, this platform can survey up to 75 acres, at 3 inches of spatial resolution in less than 20 minutes, while flying a pre-defined flight path at 23 miles per hour, at 300 feet above ground level.  Then thanks to Pix4D mapping software, which is used to combine the pictures collected by the sUAS's GoPro into a single image mosaic, automated photogrammetric processes can render a digital terrain model from the images with a vertical accuracy close to the same 3 inches spatial resolution found in the original image collection.

IGIS has introduced sUAS and remote sensing training into our workshop schedule for this year.  Please check out our IGIS training calendar by Clicking Here for more information.

Monday
Nov092015

2005-2015: A decade of intense innovation in mapping

The GIF began in November 2015 on a wave of excitement around geospatial technology. In the months leading up to our first GIS Day in 2005, Google Maps launched, then went mobile; Google Earth launched in the summer; and NASA Blue Marble arrived. Hurricane Katrina changed the way we map disasters in real time. The opening up of the Landsat archive at no-cost by the USGS revolutionized how we can monitor the Earth's surface by allowing dense time-series analysis. These and other developments made viewing our world with detail, ease, and beauty commonplace, but these were nothing short of revolutionary - spurring new developments in science, governance and business. The decade since then has been one of intense innovation, and we have seen a rush in geospatial technologies that have enriched our lives immeasurably. In November 2015 we can recognize a similar wave of excitement around geospatial technology as we experienced a decade ago, one that is more diverse and far reaching than in 2005. This GIS Day we would like to highlight the societal benefit derived from innovators across academia, non-profits, government, and industry. Our panel discussion on the 18th has representatives from several local innovators in the field, including: Stamen Designs, Geowing, PlanetLabs, 3D Robotics, NASA, iNaturalist.org, and Google, who will discuss their perspectives on the boom in Bay Area mapping. 

Please think about joining us at GIS Day!

http://gif.berkeley.edu/gisday.html

Monday
Nov022015

Fun with drones and trees

A bit late, but better late than never. Our October trip to Hopland with IGIS and 3DRobotics was great fun, and very informative. We tested the ‘Solo’ UAV with three different cameras: the typical GoPro, NIR GoPro (with post-market monkeying with filters to get IR), and a high res Canon lens.  

Key points:

  • 3DR’s flight planning software is ridiculously easy to set up and use.  
  • 3DR’s new software package can do the mosaicking. 
  • 3D models from multiple images seem easy to create. 
  • Still want to put a better scientific camera with more bands on the Solo. 

Still, lots of fun, stay tuned for more pics and an evaluation of the collected imagery. 


Sunday
Nov012015

MODIS and R: a dream partnership

Found by Natalie: 

Tuck, Sean L., Helen RP Phillips, Rogier E. Hintzen, Jörn PW Scharlemann, Andy Purvis, and Lawrence N. Hudson. "MODISTools–downloading and processing MODIS remotely sensed data in R." Ecology and evolution 4, no. 24 (2014): 4658-4668. And it is Open Access!

Abstract

Remotely sensed data available at medium to high resolution across global spatial and temporal scales are a valuable resource for ecologists. In particu- lar, products from NASA’s MODerate-resolution Imaging Spectroradiometer (MODIS), providing twice-daily global coverage, have been widely used for eco- logical applications. We present MODISTools, an R package designed to improve the accessing, downloading, and processing of remotely sensed MODIS data. MODISTools automates the process of data downloading and processing from any number of locations, time periods, and MODIS products. This auto- mation reduces the risk of human error, and the researcher effort required compared to manual per-location downloads. The package will be particularly useful for ecological studies that include multiple sites, such as meta-analyses, observation networks, and globally distributed experiments. We give examples of the simple, reproducible workflow that MODISTools provides and of the checks that are carried out in the process. The end product is in a format that is amenable to statistical modeling. We analyzed the relationship between spe- cies richness across multiple higher taxa observed at 526 sites in temperate for- ests and vegetation indices, measures of aboveground net primary productivity. We downloaded MODIS derived vegetation index time series for each location where the species richness had been sampled, and summarized the data into three measures: maximum time-series value, temporal mean, and temporal vari- ability. On average, species richness covaried positively with our vegetation index measures. Different higher taxa show different positive relationships with vegetation indices. Models had high R2 values, suggesting higher taxon identity and a gradient of vegetation index together explain most of the variation in species richness in our data. MODISTools can be used on Windows, Mac, and Linux platforms, and is available from CRAN and GitHub (https://github.com/ seantuck12/MODISTools). 

Tuesday
Oct202015

Where is the best source for NAIP information for California? 

How many times has NAIP been acquired for California? 
According to DFG, we have:

  • NAIP 2014 aerial imagery, 1 m, 4 variations (natural color, 4-band, CIR/false color, NDVI)
  • NAIP 2012 aerial imagery, 1 m, 4 variations (natural color, 4-band, CIR/false color, NDVI) 
  • NAIP 2010 aerial imagery, 1 m, 4 variations (natural color, 4-band, CIR/false color, NDVI) 
  • NAIP 2009 aerial imagery, 1 m, 4 variations (natural color, 4-band, CIR/false color, NDVI) 
  • NAIP 2005 aerial imagery, 1 m (natural color)

I was not aware the flight schedule was this frequent. 

Still, I can't find a definitive information source that helps. 

Thursday
Aug132015

Funny pic on Google Maps

This is the island of Nihoa, northwest of Kauai, viewed in Google Maps. Hawaii on my mind. Anyway, it is a funny shot with mixed resolutions, bathymetry and optical imagery, and what looks to be a bordered image without its adjacent partner images. Web link: https://www.google.com/maps/@23.0606579,-161.8639537,39656m/data=!3m1!1e3
Tuesday
May122015

Wow! New world view Chrome plugin

Kelly turned us on to this plugin from Google. Each time you get a new tab on your browser, you get treated to a new picture of the earth! But, check this one out: 

From Drebkau, Germany. I have no idea what this is an image of - could it be grain fields of some kind, or is it just someone at Google's garage sale carpet? Any thoughts? 

Here is another view of the same area:

Friday
Apr032015

Big data, Landsat and earth science