A new tool for finding old maps: USGS topoView

Get your topo maps!
The USGS recently unvieled a new, extremely easy and enviably sleek web mapping interface to search and download nearly 178,000 topographical maps, dating from 1880 to 2010.
geospatial matters
Please read the UC Berkeley Computer Use Policy. Only members can post comments on this blog.
Get your topo maps!
The USGS recently unvieled a new, extremely easy and enviably sleek web mapping interface to search and download nearly 178,000 topographical maps, dating from 1880 to 2010.
Did you know that Apple maps labels more cities than Google maps but Google labels more roads then Apple? Fun facts galor! Find out more differences between these too maps then you ever knew you wanted to know in this great article here, and keep your eye out for part too soon to come! Happy comparing!
Want to keep tabs on fire incidient near you, your friends or family? Want to create an alert for your vacation cabin?Maybe just curious about digging deep into incident reports? The US Forest Serivce has released a beta web mapping application to do all that and more. Check it out!
You’ve heard that millions of California’s trees have died from drought and bark beetles. Weakened by lack of water due to four consecutive years of drought, over 29 million conifers and hardwood trees were unable to fight off attacks from bark beetles and died. Check out where and when these trees have died across California using the new Tree Mortality Viewer from FRAP, CalFire, and USFS
Tree Mortality Viewer: Mortality at Point Reyes National Seashore
Overlayed on a map of California, the Viewer visibility layers show:
You can download the original data here too!
Awesome new (ish?) R package from the gang over at rOpenSci
Tired of searching biodiversity occurance data through individual platforms? The "spocc" package comes to your rescue and allows for a streamlined workflow in the collection and mapping of species occurrence data from range of sites including: GBIF, iNaturalist, Ecoengine, AntWeb, eBird, and USGS's BISON.
There is a caveat however, since the sites use alot of the same repositories the authors of the package caution to check for dulicates. Regardless what a great way to simplify your workflow!
Find the package from CRAN: install.packages("spocc") and read more about it here!
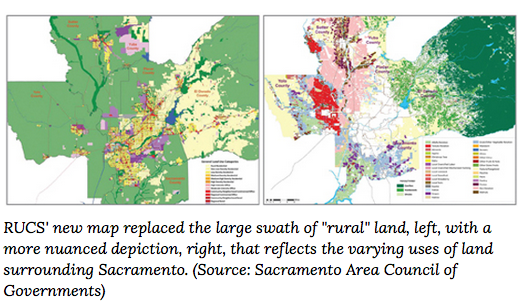
What started as a realtively small project in the Sacramento area to understand the rural agricultural sector has quickly transitioned into a project that hopes to have statewide impact. The premise of the project began with the ideas that planning maps and county data were unrepresentative of rural agricultural areas which in maps were shown as a single color, "green". Using pesticide report data and remote sensing imagery the project was able to assemble a much more vibrant and representative map that now serves as the backbone of their models.
This project called Rural-Urban Connections Strategy or RUCS for short made a huge impact on how the city council and politicans were veiwing the agricultural sector. Once the data was collected the folks at RUCS created an econometrics model to understanding the needs and costs of changing agricultural production across the area. See more about the model they employed here and more information on their approach here
Using the methodology and tools below understanding the rural and urban connections of agricultural will become transferable and scalable so any local, regional, state or federal organization may adapt them.
1. SACOG created a CROP MAP that details agriculture production at the field level across more than 2 million acres of farmland.
2. Building on the crop map, the ECONOMETRIC MODEL tests how cropping patterns could change under different conditions such as changes input costs.
3 The DIET/LAND NEEDS MODEL estimates how much land is needed to meet demand for locally grown food.
4 The I-PLACE3S web-based land use modeling tool facilitates land use planning for agriculture and ruralcommunities. .
5 The INFRASTRUCTURE/FISCAL MODEL (IMPACS) provides local governments a means of evaluating the fiscal challenges and opportunities of providing infrastructure and services in their communities.
Now the questions is how and where to scale RUCS up to a statewide assessment tool. More to come in furture conversations with the folks over at RUCS
Other helpful links from our discussion
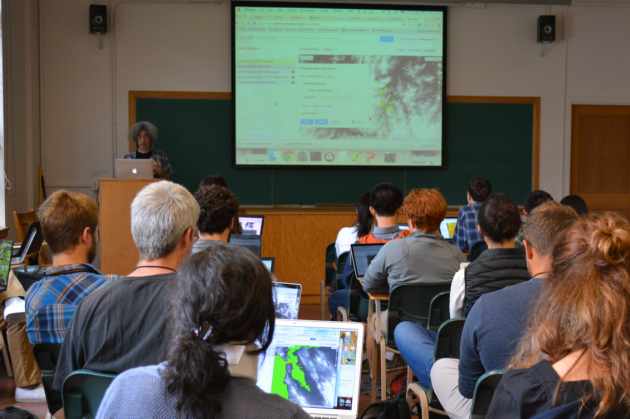
Students, researchers, mappers, and big data enthusiasts took place in an exciting 2 day Google Earth Engine workshop this last week hosted by the GIF and the Google Earth Engine Team. We had an exiting overview of the latest and greatest research adventures from Google by Kelly lab alum Karin Tuxen-Bettman including advances in some of what Google Earth Outreach team is involved in...
In response to Gov. Jerry Brown's announcement yesterday, calling all California residents to reduce water use by 25%, the folks at the New York Times put togther a nice interactive map. The map shows residential water use in California in gallons per day.
Take a look here!
In lab group meetings we have been discussing the evolution and future of Spatial Data Science as a discipline.
Therefore when I recently stummbled upon a article about a reserarch project looking at the evolution of Geography based on a database of Doctoral Dissertation Titles, I couldn't help but be excited, and intrigued by the connection.
This reasearch from Kent University Professors David Kaplan and Jennifer Mapes is also reminiscent of Kelly Lab's own Shufei Lei's recent work analyzing and mapping textual data in the context of ecological systems and adapative managment!
Just like spatial data science, Geography as a discipline has struggled with defining its' complex identity, its principles and concepts spanning and borrowing from several established discipinces.
From the article:
"Geography is a relatively young discipline in terms of university academics, and for much of its history, geographers have struggled to define what exactly the discipline includes, said Keith Woodward, an assistant professor of geography at the University of Wisconsin at Madison.
So for a historical perspective, this type of database would be helpful looking at a timeline of how geographers defined their field, Woodward said."
The database is a compliation of 10,290 dissertations ranging back to the late 1800's with the goal of understanding the trends, concentrations, and expansion of Geography as a discipline over time.
Although currently unpublished (look out for an article in Geographical Review early 2015) there are a few preliminary findings and possibilites that sound immensly interesting:
"The study maps which universities have high percentages of dissertations focused on domestic or foreign regions, and also shifts in which regions of the world were popular topics for dissertations."
"A database of dissertations could provide a glimpse into what academics are interested in and how their focuses shifts as de-colonization and globalization occurs, Woodward said."
"Much of the focus so far has been on the words within the dissertation titles and how they’re used. Geographers today like to explain the field as a study of space and place, Mapes said. But those words didn’t become popular in dissertations until the 1960s."
Read the full article here and look out for an article in Geographical Review early 2015.