blog authors
past blog entries

Welcome to the Kellylab blog

geospatial matters

Please read the UC Berkeley Computer Use Policy. Only members can post comments on this blog.

Entries by sam (34)

Friday
Apr252014

1966 Lunar Orbiter 1 Images of Earth Recovered

comparison of the original Earthrise image as seen by the public in 1966 and the restored image released in 2008Interesting article from Wired on the recovery of forgotten images from the 1966 Lunar Orbiter 1 mission. The images were taken from a probe orbiting the moon and contain images of the surface of the moon and distant Earth including the first high resolution photographs ever taken from behind the lunar horizon of an Earthrise. The images were recovered from analog data tapes at NASA Ames and have not been seen publicly since the original data from the mission was received in the late 1960s and never at such high resolution. The historical images of Earth are now being used to fill in gaps about Earth's climate in the 1960s. For the full story click here.

Thursday
Feb132014

Clark Labs to Create Cloud-based Land Change Modeler for ArcGIS

Clark Labs was awarded a million dollar grant from Esri to create a cloud-based version of their Land Change Modeler for ArcGIS. Land Change Modeler is suite of tools to assess and predict land change and evaluate the impacts of change and includes REDD (Reducing Emissions from Deforestation and Forest Degradation) tools for modeling the impact of land cover change on carbon emissions. Currently Land Change Modeler is only available in IDRISI and as a software extension for ArcGIS (the latest version is compatible with v10.2). This will make this tool more easily assessable to the wider public and scientific community.

From Clark Labs press release:

"Clark Labs was recently awarded a million dollar grant from Esri to create a cloud-based version of their Land Change Modeler for ArcGIS. Currently, Clark Labs’ extension is for the ArcGIS desktop.

Land Change Modeler for ArcGIS, first released in 2007 with Version 2 released this past month, is a software extension for ArcGIS users, offering a suite of tools to assess and predict land change and evaluate the impacts of such change. Clark Labs recent release includes many significant enhancements. The new version is compatible with ArcGIS Version 10.2

The Land Change Modeler offers an extensive suite of tools for land change research in a simple and automated workflow. It provides a variety of tools for land change analysis and prediction, as well as the impacts of those changes.

The new version release of this fall provides significant enhancements, particularly for its utility for REDD (Reducing Emissions from Deforestation and Forest Degradation). Land Change Modeler now includes functionality for modeling the impact of land cover change on carbon emissions. “Our world is changing rapidly, and technology to efficiently model and predict future land change is vital to addressing global challenges,’ said Jack Dangermond, Esri President. “We’re pleased to award this grant to Clark Labs to jumpstart their effort to utilize and provide rich content through ArcGIS Online.”

The new version also provides more capability for estimating land change impacts on habitat and biodiversity. With the grant from Esri, Clark Labs will be creating a cloud-based implementation of Land Change Modeler for their platform.

Clark Labs and Esri have been business partners for nearly ten years, working collaboratively on GIS research."

For the full news release see here.

Tuesday
Oct082013

California Geoportal Offers One-Stop Shop for Statewide GIS Data

The California Geoportal, officially launched in March 2013 (see here for related launch press release), augments and in some ways replaces the original Cal-Atlas statewide GIS data download webpage with a more simplified, smooth, and more intuitive website for all GIS related data in the state. You can now search or browse for GIS data by geography and any corresponding metadata using traditional search queries as well as by using a standalone webGIS interface. The portal also provides direct download links to some Oregon and Nevada state GIS datasets. The site acts as a GIS data repository for publicly available GIS data and related documents and maps from state agencies and local and regional governments. Rather than hosting the physical data, the site instead acts as a library of direct download links to datasets that connect directly to the author’s databases. The site also links you to other state GIS applications such as the California Coastal Geoportal and webGIS viewers from various state agencies.

Screenshot of the CA Geoportal

Screenshot of the CA Geoportal Map ViewerSee below for an informative video on how and why the portal was created and for highlights of features:

Tuesday
Oct082013

New 2012-2013 SOD Confirmations Added to OakMapper!

New 2013 SOD Blitz and 2012-13 UC Davis DataNew confirmed cases of Sudden Oak Death (SOD) (P. ramorum) have been added to OakMapper, a project that tracks the spread of Sudden Oak Death from data collected by citizens and organizations. All official SOD cases are collected and confirmed by the California Department of Food and Agriculture or the University of California. Community SOD cases are submitted by citizens via the OakMapper website and iPhone application. 442 new points collected between 2012-2013 have been added to OakMapper bringing the total number of confirmed SOD locations to 3246. The new data consists of laboratory confirmed cases collected by the annual SOD Blitz campaign of 2013 from the Forest Pathology and Mycology Lab run by Dr. Matteo Garbelotto and also laboratory confirmed cases collected by the UC Davis Rizzo Lab run by Dr. David Rizzo.

Click on the image left to view a close-up of the new confirmed SOD data (in green) from SOD Blitz and UC Davis. 

Explore the new data online here.

OakMapper.org


Wednesday
May152013

Bay Area Inequality & Mass Transit

Dan Grover and Mike Z created an interactive data visualization that shows the income distribution along mass transit routes in the Bay Area. 2010 Census median household income for each mass transit station within a census tract for MUNI metro and bus, BART, and CalTrain routes are currently viewable. The project was inspired by The New Yorker’s New York City income distribution viewer for the New York Subway here.

Screenshot of data viewer from dangrover.github.io

Wednesday
May152013

Google Timelapse

Google recently released the Timelapse project, hosted by Time Magazine, which shows Landsat images from 1984 to today in a timelapse video animation for the entire globe. The viewer allows users to navigate to any spot on the globe via place name and visualize changes on the earth’s surface over the time period captured by Landsat. Google highlights specific areas of interest such as Dubai, Las Vegas, and the Amazon.

Click the image below for more info and to access the site:

Screenshot of Google Timelapse on Time.com

Friday
Mar012013

New 2012 SOD Confirmations Added to OakMapper!

New SOD Blitz 2012 Data

New confirmed cases of Sudden Oak Death (SOD) (P. ramorum) have been added to OakMapper, a project that tracks the spread of Sudden Oak Death from data collected by citizens and organizations. All official SOD cases are collected and confirmed by the California Department of Food and Agriculture or the University of California. Community SOD cases are submitted by citizens via the OakMapper website and iPhone application. 613 new points collected in 2012 have been added to OakMapper bringing the total number of confirmed SOD locations to 2804. The new data consists of laboratory confirmed cases collected by the annual SOD Blitz campaign of 2012 from the Forest Pathology and Mycology Lab run by Dr. Matteo Garbelotto. 

Click on the image in the upper left to view a close-up of the new confirmed SOD data (in green) from the SOD Blitz 2012. 

Explore the new data online here.

OakMapper.org

Tuesday
Sep112012

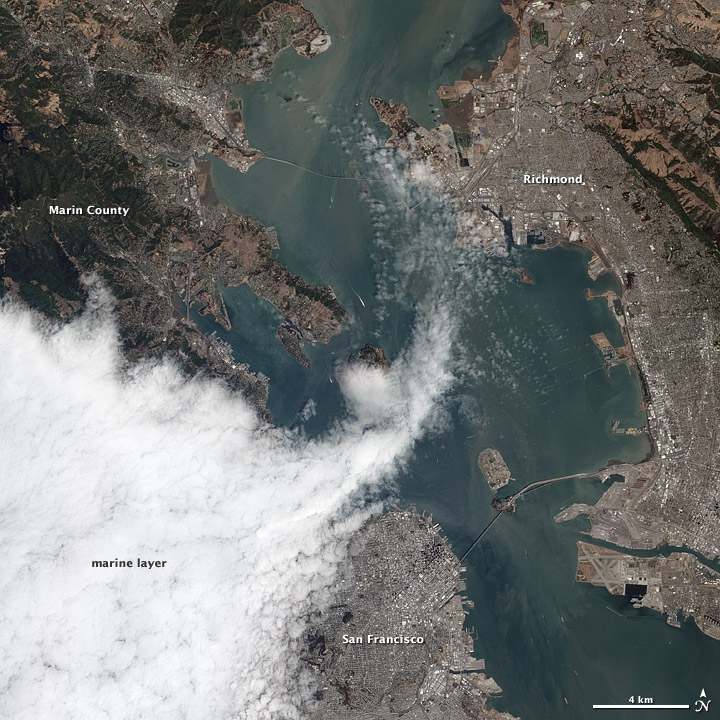
San Francisco Bay fog viewed from space

Here is a neat satellite image released by NASA Earth Observatory of fog rolling into the San Francisco Bay. The Advanced Land Imager (ALI) on NASA’s Earth Observing-1 satellite acquired this image on August 16, 2012. For more information on the image and the story behind click here.

Credit: NASA Earth Observatory: Advanced Land Imager (ALI) August 16, 2012

Wednesday
Sep052012

One Hundred Years of Land Values in Chicago

Gabriel Ahlfeldt, from the London School of Economics, presents in a video in the link below on an interesting project that digitized Olcott's Blue Books, a unique dataset of historical land values, land uses, building heights, and other information in Chicago and its suburbs, published annually between 1900 and 1990. The digitized information from the Blue Books allows for detailed historical statistical and geospatial analyses. The visualization of the data is presented in the video using GIS software.

View the video on youtube by clicking here.

Wednesday
Sep052012

1906 Earthquake & Present Day Photo Mashup

Shawn Clover recently released part 2 of his “1906 + Today: The Earthquake Blend” series which is a mashup of 1906 earthquake aftermath photos in San Francisco with present day photos at the same location. The photos are blended creating a seamless image of the past superimposed on the present.

View part 1 of the series here from 2010 and part 2 of the series here from 2012.

Credit: shawnclover.com