Wednesday
Sep262012
New green blog about our web participation paper
Check it out! our recent paper on the SNAMP website is featured in the green blog.
geospatial matters
Please read the UC Berkeley Computer Use Policy. Only members can post comments on this blog.
Check it out! our recent paper on the SNAMP website is featured in the green blog.
At a recent workshop I gave on webGIS, after giving an overview of some of the recent uses of crowdsourced and VGI in disasters (fire in San Diego, earthquake in Christchurch, Ushahidi everywhere...), I was asked about success of these projects. Who used the data? How? (and who funded these websites, but that is another story.) And I had only the vaguest of answers. Here is a thoughful critique on this subject by Paul Currion on MobileActive.org. He examines the use of the Ushahidi project in Haiti. Paul is an aid worker who has been working on the use of ICTs in large-scale emergencies for the last 10 years. He asks whether crowdsourcing adds significant value to responding to humanitarian emergencies, arguing that merely increasing the quantity of information in the wake of a large-scale emergency may be counterproductive. Why? because aid workers need clear answers, not a fire-hose of information. Information from the crowd needs to be curated, organized, targeted for response. He makes the point that since crowdsourced data is going have to be sorted through, and can be biased, and can be temporary, aid agencies are going to have to carry out exactly the same needs assessments that they would done without the crowdsourced information.
Where and when do crowdsourced data add value to a situation or project? How can we effectively deal with the bias in the data that comes naturally? We deal with this all the time in my smaller web-related projects: oakmapper and snamp for example. What is the future role of the web for adaptive forest management for example? How do these new collaborative and extensive tools help us make important decisions about natural resources management in often contentious contexts? More to think about.
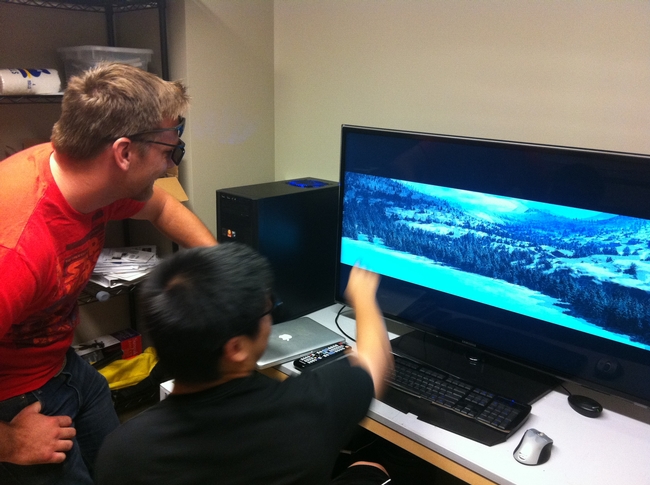 The SNAMP spatial team and the cool lidar work we are doing was recently featured in ANR's Green Blog. The article highlights the work of UC Merced in forest visualization. Currently, most visualization software packages focus on one forest stand at a time (hundreds of acres), but now we can visualize an entire forest, from ridge top to ridge top. The Sierra Nevada Adaptive Management Project (SNAMP) Spatial Team principle investigators Qinghua Guo and Maggi Kelly, and graduate student Jacob Flanagan and undergraduate research assistant Lawrence Lam have created cutting-edge software that allows us to visualize the entire firescape (thousands of acres).
http://www.sacbee.com/2012/06/04/4537900/deal-reached-for-tracking-sierra.html
The U.S. Forest Service and conservation groups have reached an agreement to strengthen monitoring of Sierra Nevada wildlife.
A nice article about SNAMP is now in the recent version of California Agriculture. In the same edition is a great series of articles about the 150 anniversary of the Morrill Land-Grant College Act which made higher education available to those in every social class, and brought practical information to a nation that was then more than 50% farmers. Cooperative Extension was born with this Act, and it continues to evolve today. A summary by Janet L. White is here.
California Agriculture 66(2):39-39. DOI: 10.3733/ca.v066n02p39a. April-June 2012.
In 1862, in a nation torn by secession and Civil War, President Abraham Lincoln signed a visionary law that laid the cornerstone of public higher education. The Morrill Land-Grant College Act gave federal public lands to states, allotting 30,000 acres for each Senator and Representative. The total endowment was $7.55 million, then the value of 17.4 million acres. Today, more than 100 land-grant universities serve the nation and the world, including what many believe is the greatest public university in the world, the University of California.
On the 150th anniversary of its passage, we pay tribute to this profoundly democratic law, which made higher education available to those in every social class, and brought practical information to a nation that was then more than 50% farmers. It was followed by other landmark education laws: the 1887 Hatch Act, establishing Agricultural Experiment Stations at universities; a second Morrill Act in 1890, initiating regular funding; the Smith-Lever Act of 1914, establishing Cooperative Extension; and in 1944, the GI Bill. Today, UC's land-grant university thrives as the Agricultural Experiment Stations at UC Berkeley, Davis and Riverside, and in UC Cooperative Extension offices that serve every county.
See see pages 40 to 49 for special coverage of the Morrill Act and its role in building the University of California.
 ASPRS 2012, held in Sacramento California, had about 1,100 participants. I am back to being bullish about our organization, as I now recognize that ASPRS is the only place in geospatial sciences where members of government, industry, and academia can meet, discuss, and network in a meaningful way. I saw a number of great talks, met with some energetic and informative industry reps, and got to catch up with old friends. Some highlights: Wednesday's Keynote speaker was David Thau from Google Earth Engine whose talk "Terapixels for Everyone" was designed to showcase the ways in which the public's awareness of imagery, and their ability to interact with geospatial data, are increasing. He calls this phenomena (and GEE plays a big role here): "geo-literacy for all", and discussed new technologies for data/imagery acquisition, processing, and dissemination to a broad public(s) that can include policy makers, land managers, and scientists. USGS's Ken Hudnut was Thursday's Keynote, and he had a sobering message about California earthquakes, and the need (and use) of geospatial intelligence in disaster preparedness.
Berkeley was well represented: Kevin and Brian from the GIF gave a great workshop on open source web, Kevin presented new developments in cal-adapt, Lisa and Iryna presented chapters from their respective dissertations, both relating to wetlands, and our SNAMP lidar session with Sam, Marek, and Feng (with Wenkai and Jacob from UCMerced) was just great!
So, what is in the future for remote sensing/geospatial analysis as told at ASPRS 2012? Here are some highlights:
Thanks Marek! Flying into our northern SNAMP field site via landsat to lidar.
Happy New Year everyone.
The US Forest Service has released their "forest to faucet" program last week. It looks at the importance of forests to surface water. Built in ArcGIS server, it quickly maps, by watershed:
Check it out: http://www.fs.fed.us/ecosystemservices/FS_Efforts/forests2faucets.shtml
 New article in the UC Green Blog on our SNAMP project, written by Kim Ingram. Includes some great field pics!
The University of California Cooperative Extension (UCCE) recently co-hosted a field trip with the U.S. Forest Service to view the implementation of a forest fuels reduction project on the Tahoe National Forest.
Over 45 stakeholders, including representatives of state, federal, and local government, industry and environmental groups and local residents attended to see the project, known as the "Last Chance Project," which involves thinning the forest by removing small and medium-sized trees, masticating or mowing down brush, and burning dead material through prescribed fire. The work, being done by Sierra Pacific Industries, under contract to the U.S. Forest Service, should be completed by fall 2012.
This is an exerpt from our recent SNAMP newsletter on our lidar work, written by me, Sam, and Qinghua.
We are using Lidar data to map forests before and after vegetation treatments and measuring forest habitat characteristics across our treatment and control sites. These data will give us detailed information about how forest habitat was affected by fuel management treatments.
 Visualizing the forest
The image at left is not a photograph: it is a computer generated image of our SNAMP study area, using only Lidar data. These kinds of visualizations are commonly used in the forestry field for stand and landscape management, and to predict environments into the future. But visualization software packages usually only focus on one stand at a time. Our method allows us to visualize the whole firescape. This is useful for understanding the complexity in forest structure across the landscape, how the forest recovers from treatments, and how animals with large home ranges might use the forest. The UC Merced team created this cutting-edge product.
Finding the trees in the forest
In order to see the trees in the forest, the UC Merced spatial team researchers developed a method to segment individual trees from the Lidar point cloud. The method identifies and classifies trees individually and sequentially from the tallest tree to the shortest tree. We tested this method on our SNAMP Lidar data. These forests are complex mixed coniferous forests on rugged terrain, and yet our method is very accurate at defining individual tree shapes. We are applying the method in both of the SNAMP study areas.
 Mapping downed Logs with lidar data
The UC Berkeley spatial team researchers used some new techniques that help distinguish individual features, and mapped the logs, as well as some of the trees in this stand. In the figure at left: red colors are logs, green colors are trees.
More information on these and other projects can be found on the SNAMP website.
 Maggi
Maggi