blog authors
past blog entries

Welcome to the Kellylab blog

geospatial matters

Please read the UC Berkeley Computer Use Policy. Only members can post comments on this blog.

Friday
Nov132015

California Economic Summit wrap-up

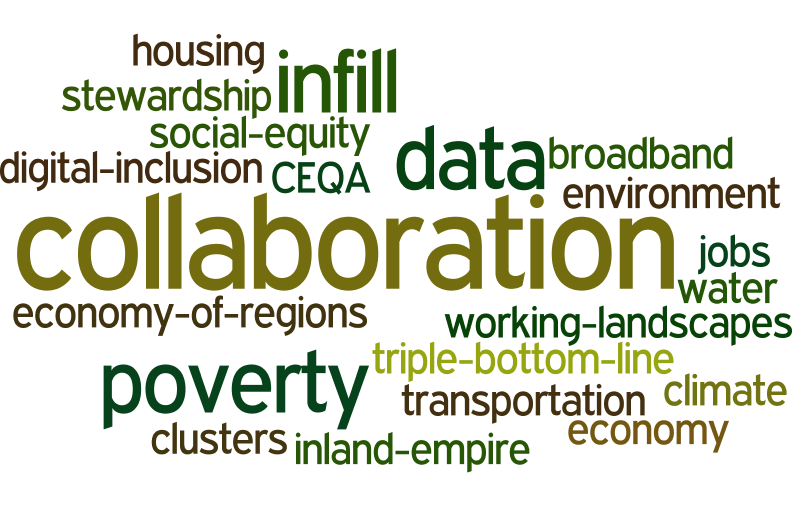
my wordle cloud on topics commonly discussed at the summit

I spent two days at the California Economic Summit, held this year in Ontario, heart of the "inland empire". I learned much about this region of the state that I know mostly as freeways connecting water polo games, or as endless similar roads through malls and housing developments. It is more populous, diverse, and vibrant than I had realized. The conference itself was very different from any that I have been to. Hardly any presentations, but break-out groups, passionate, inspiring panelists, tons of networking, good overviews, multiple perspectives, and no partisanship.

Here are some interesting facts about California that I did not know: 

  • 80% of CEQA lawsuits are related to urban infill development. Shocking. We need infill development as a sensible solution to a growing California. 
  • 1 in 3 children in the Central Valley live in poverty. 1 in 4 kids live in poverty in the inland empire. These rates are WORSE than they have been ever. 
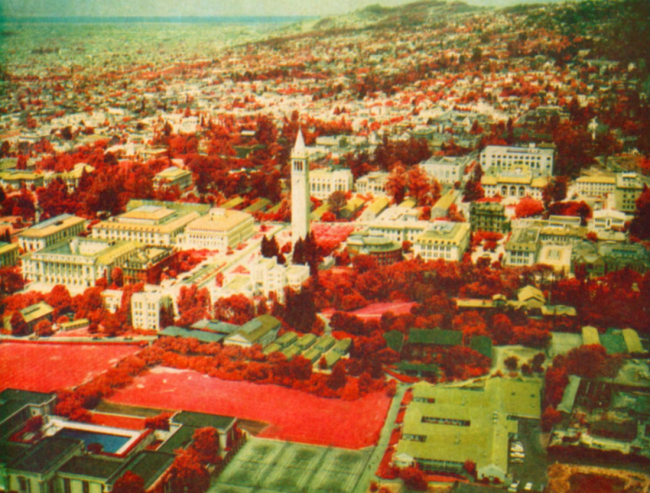
  • The Bay Area is an anomaly in terms of education, income, health, voting rates, broadband adoption. The Bay Area is not representative of the state!
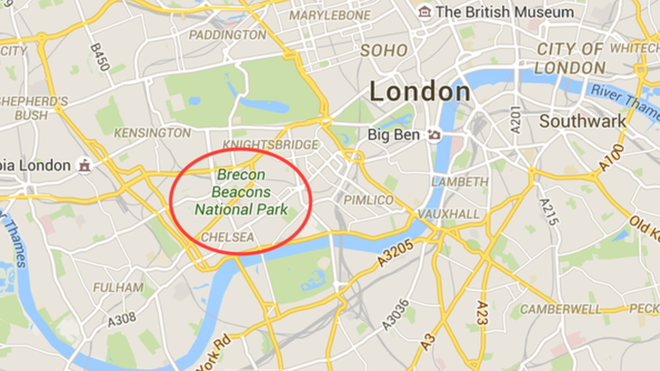
  • Think of a west-east line drawn across the state to demark the population halfway line. Where might it be? No surprise it is moving south. Now it runs almost along Wilshire Blvd in LA!
  • Empowering the Latino community in the state is going to be key in continued success. 
  • Broadband adoption around the state is highly variable: Latino, poor and disabled communities are far below other communities in terms of adoption. 
  • The first beer made with recyled water has been made by Maverick's Brewing Company. 
  • Dragon Fruit might be the new water-wise avocado. Good anti-oxidents, massive vitamin C, good fiber, etc. They taste a bit like a less sweet kiwi, with a bit of texture from the seeds. I don't think I'd like the quac, however. 
  • In 15 years, the state will be in a deficit of college graduates needed to meet skilled jobs. Those 2030 graduates are in 1st grade now, so we can do some planning. 
  • Access, affordability, and attainability are the cornerstones of our great UC system. 

In every session I attended I heard about the need for, and lack of collaboration between agencies, entities, people, in order to make our future better. Here is my wordle cloud of discussion topics, from my biased perspective, or course. 

Wednesday
Nov112015

Honorary Geographer Maya Lin

When entertaining out of town visitors in the Bay Area you have a bounty of choices. Many years ago I took visitors to SFMOMA and stumbled into a Maya Lin exhibit. It blew my mind, and I've been a fan ever since. (I've even invited her to give a geolunch talk, but alas it has not happened.) At that time, I had no idea she was the the designer of the Vietnam Veterans Memorial in Washington, D.C., which I found to be a sublime work of reverance. She makes art with strong clear forms that echo the earth. I think what she does resonates with me so much because the idea of spatial representation of geographic form is for me the heart of all we do in science, yet it allows for deep and immediate understanding of place. Whenever I see one of her pieces, I "get" it very quickly, and always feel a little bit happier. Art, what can you say. 

Maya Lin: SF Bay @ Brower CenterShe had a small installation recently in the Brower Center in Berkeley. It was lovely. I can't find it on her website, so you will have to trust this. I include one picture here at left.  It is a representation of the Bay, made in some kind of metal, mounted flush on the wall.  In the same show she had a model of the Sacramento River made from silver stick pins, also mounted on the wall - very fluid and playful with light. I use a slide of her model of the SF Bay shown here as an into into my lectures on modeling (also a shot of the weird and wonderful SF Bay model in Sausalito, more about that anon). 
Her most recent work at the Smithsonian's newly renovated Renwick Gallery uses green marbles to model the Chesapeake Bay. It is a stunning piece, I wish I could be there. I read about the work here.  
Maya Lin: Chesapeake Bay, Smithsonian
Her description of a recent (2008) installation at the California Academy of Sciences in SF "Where the Land Meets the Sea" says: "By using science and technology in her artwork to create new ways of looking at the environment, Maya Lin's work inspires viewers to pay closer attention to the natural world." I think that is true, but it is also true that it is pleasing because it is so apart from the natural world and yet so resonant with it. If that makes any sense. The work is below:
Maya Lin's Where the Land Meets the Sea at Cal Academy in 2008
In that piece (picture above) modeling the shape of the SF Bay, the terrain (or bathymetry) is based on data supplied by the U.S. Geological Survey, among others, and represents a 1:700 scale with a vertical exaggeration of 5 times above sea level and 10 times below. Sea level is 18 feet above the terrace.
Looking forward to seeing more of her work, in person if possible. 


Tuesday
Nov102015

National Park moved 150 miles to the east to take up role as urban escape

Here is a funny response to a major map error on Google Maps, found last month. From BBC Wales: http://www.bbc.com/news/uk-wales-mid-wales-34410736

The gorgeous Brecon Beacons was erroneously positioned outside of downtown London. The technical error has directed people searching for the national park more than 150m (241km) away to a location between Chelsea and Knightsbridge.

Brecon Beacons National Park Authority posted the image online with the caption: "We have now moved. Londoners get an upgrade thanks to Google Maps."

Chief executive John Cook joked: "Well the move has come as a bit of a shock to us all."

He added: "I'm sure it will come as good news to Londoners who want some fresh mountain air on their doorstep.

"The truth is we are only three hours away from London - don't rely on your sat-nav or Google Maps - just head to Bristol on the M4, cross the bridge, ask a local and they'll know exactly where to find us."

Hilarious response. I've been walking on the Beacons exactly once, and it was divine. 

Monday
Nov092015

2005-2015: A decade of intense innovation in mapping

The GIF began in November 2015 on a wave of excitement around geospatial technology. In the months leading up to our first GIS Day in 2005, Google Maps launched, then went mobile; Google Earth launched in the summer; and NASA Blue Marble arrived. Hurricane Katrina changed the way we map disasters in real time. The opening up of the Landsat archive at no-cost by the USGS revolutionized how we can monitor the Earth's surface by allowing dense time-series analysis. These and other developments made viewing our world with detail, ease, and beauty commonplace, but these were nothing short of revolutionary - spurring new developments in science, governance and business. The decade since then has been one of intense innovation, and we have seen a rush in geospatial technologies that have enriched our lives immeasurably. In November 2015 we can recognize a similar wave of excitement around geospatial technology as we experienced a decade ago, one that is more diverse and far reaching than in 2005. This GIS Day we would like to highlight the societal benefit derived from innovators across academia, non-profits, government, and industry. Our panel discussion on the 18th has representatives from several local innovators in the field, including: Stamen Designs, Geowing, PlanetLabs, 3D Robotics, NASA, iNaturalist.org, and Google, who will discuss their perspectives on the boom in Bay Area mapping. 

Please think about joining us at GIS Day!

http://gif.berkeley.edu/gisday.html

Tuesday
Nov032015

Robert Colwell Musings Part 2

I started this last year when I was working on a retrospective of remote sensing of forests in California for the centennial of Berkeley Forestry. In the article I tried to highlight some of the pioneering work done by remote sensors that focused on Californian forests from the 1960s through the use of lidar today. As is often the case, the paper changed into something a bit more focused on lidar technology, and I had to cut most of the Colwell stuff. So, I reprise some information about him here, add my perspective on his work as antecedants to modern OBIA approaches, and include his rad interior design ideas. 

Early musings on forest objects by Colwell in 1964.

Dr. Colwell was an internationally renowned remote sensing scientist; he was former associate director of the Space Sciences Laboratory at the UC Berkeley, and he was the instructor of remote sensing in our own Mulford Hall from 1947 until his retirement in 1983. He was NASA co-investigator for Apollo IX, and his research in the 1960s on reflectance and multispectral reconnaissance were the primary basis for selecting the type of sensors and the spectral bands implemented in Landsat. Neat guy, and we all benefit from his intellectual legacy.

Finding meaningful blobs - a geographer’s quest

In our new Taylor and Francis book chapter, Thomas Blaschke, Helena Merschdorf, and I discuss Object-Based Image Analysis: Evolution, History, State of the Art, and Future Vision (Book website).  I did some work looking into Colwell's work, and found lots of discussion of nascent work describing object based approaches to image analysis. He struggled with the inability of algorithms to pull from digital imagery meaningful "blobs". See the examples here. 

One of Colwell's early attempts at object based work from 1973. Printout on a dot matrix printer?

His assessment of the potential for automation of an object recognition process depended on the capacities of a digital scanner and the ability of an algorithm to assess the differences, in photographic tone, between a "blob" and its surroundings (Colwell 1964, 1965). Colwell was an important advisor on the Landsat 1 mission, and his ideas on extraction of meaningful features transferred to his ambitions for the satellite missions (Colwell 1973). 

Maps as hipster decorations

I read some of his work as he transitioned from aerial photography to digital imaging, and I came across this picture. Mulford is just off the scene in the upper left corner, and Hearst Gym pool is visible in lower part. 

Oblique aerial view of Berkeley Campus of University of California taken with Camouflage Detection film. Robert N. Colwell

In his caption he says:

"Oblique aerial view of Berkeley Campus of University of California taken with Camouflage Detection film."(That is what they used to call color infrared.) "Such photography is superior to any other for certain photo interpretation purposes as indicated by some of the preceding examples. Note in this photo how color values for each species of tree tend to remain uniform from foreground to background because of the superior haze penetration offered by this film. The relatively long wavelengths to which this infrared-sensitive film reacts are scattered but very little by atmospheric haze particles, thus accounting for the uniform color values and for excellent image sharpness." I dig this part: "The original color transparencies have the same color values as seen here and consequently make very attractive panels for lamp shades, although certain of their colors fade upon prolonged exposure to light."

The trend for using map products as kitchy home decorations PRE-DATES 1970! Take that hipsters!

Articles mentioned:

Colwell, R.N. 1964. Aerial photography - A valuable sensor for the scientist. American Scientist, Vol. 52, No. 1 (MARCH 1964), pp. 16-49

Colwell, R.N., 1973. Remote Sensing as an Aid to the Management of Earth Resources. American Scientist. 61(2): 175-183.

Some more about him here: http://senate.universityofcalifornia.edu/inmemoriam/robertcolwell.htm

Monday
Nov022015

Fun with drones and trees

A bit late, but better late than never. Our October trip to Hopland with IGIS and 3DRobotics was great fun, and very informative. We tested the ‘Solo’ UAV with three different cameras: the typical GoPro, NIR GoPro (with post-market monkeying with filters to get IR), and a high res Canon lens.  

Key points:

  • 3DR’s flight planning software is ridiculously easy to set up and use.  
  • 3DR’s new software package can do the mosaicking. 
  • 3D models from multiple images seem easy to create. 
  • Still want to put a better scientific camera with more bands on the Solo. 

Still, lots of fun, stay tuned for more pics and an evaluation of the collected imagery. 


Sunday
Nov012015

MODIS and R: a dream partnership

Found by Natalie: 

Tuck, Sean L., Helen RP Phillips, Rogier E. Hintzen, Jörn PW Scharlemann, Andy Purvis, and Lawrence N. Hudson. "MODISTools–downloading and processing MODIS remotely sensed data in R." Ecology and evolution 4, no. 24 (2014): 4658-4668. And it is Open Access!

Abstract

Remotely sensed data available at medium to high resolution across global spatial and temporal scales are a valuable resource for ecologists. In particu- lar, products from NASA’s MODerate-resolution Imaging Spectroradiometer (MODIS), providing twice-daily global coverage, have been widely used for eco- logical applications. We present MODISTools, an R package designed to improve the accessing, downloading, and processing of remotely sensed MODIS data. MODISTools automates the process of data downloading and processing from any number of locations, time periods, and MODIS products. This auto- mation reduces the risk of human error, and the researcher effort required compared to manual per-location downloads. The package will be particularly useful for ecological studies that include multiple sites, such as meta-analyses, observation networks, and globally distributed experiments. We give examples of the simple, reproducible workflow that MODISTools provides and of the checks that are carried out in the process. The end product is in a format that is amenable to statistical modeling. We analyzed the relationship between spe- cies richness across multiple higher taxa observed at 526 sites in temperate for- ests and vegetation indices, measures of aboveground net primary productivity. We downloaded MODIS derived vegetation index time series for each location where the species richness had been sampled, and summarized the data into three measures: maximum time-series value, temporal mean, and temporal vari- ability. On average, species richness covaried positively with our vegetation index measures. Different higher taxa show different positive relationships with vegetation indices. Models had high R2 values, suggesting higher taxon identity and a gradient of vegetation index together explain most of the variation in species richness in our data. MODISTools can be used on Windows, Mac, and Linux platforms, and is available from CRAN and GitHub (https://github.com/ seantuck12/MODISTools). 

Tuesday
Oct272015

SAHM: VisTrails Software for Species Distribution Modeling

Shane just turned Michelle Koo and on to this software package: The Software for Assisted Habitat Modeling for VisTrails. It seems very useful for a generalized SDM workflow. 

From their blurb: The Software for Assisted Habitat Modeling for VisTrails has been created to both expedite habitat suitability modeling and help maintain a record of the various input data, pre- and post- processing steps, and modeling options incorporated in the construction of a species distribution model. SAHM is constructed as a "package" of modules that can be used within VisTrails, an open-source management and scientific workflow system designed to integrate the best of scientific workflow and scientific visualization systems. SAHM works by combining environmental predictor layers of the study area — such as climate and remote sensing data — with field sampling measurements for a particular species. The program then runs statistical models using these data to analyze habitat requirements of the species of interest and predict its potential distribution based on habitat suitability. Model outputs help land and natural resource managers generate maps to aid in predicting and managing species of concern.

https://www.fort.usgs.gov/products/23403

Wednesday
Oct212015

GIS Day 2015! Happy 10th Birthday to the GIF

Please join us for GIS Day 2015!  

You are all welcome to visit us at the Geospatial Innovation Facility for this year’s GIS Day Celebration on Wednesday, November 18th. This year’s event is co-hosted by the GIF and BayGeo (formerly the Bay Area Automated Mapping Association, or BAAMA). 

Not only are we celebrating all things geospatial for GIS Day, we are also celebrating the GIF’s 10th year anniversary! The GIF was formally started at a GIS Day event in 2005. As in previous years, we will be having a poster session, many exciting talks, and refreshments. It is a great time to network and catch up with what is going on with mapping around the SF Bay Area. 

Instead of a Keynote talk, this year we will be holding a Plenary Session in the early evening with local innovators from Bay Area Industry, Government and Non-Profits (including Stamen, PlanetLabs, Google, 3DRobotics, GeoWing, iNaturalist, and NASA) who all focus on state-of-the-art geospatial technology and solutions. The discussion will cover such topics as what skills they look for in recruiting, where they see the geospatial world going in the next 5 years, and how we can better partner around the bay to stay at the forefront of the geospatial revolution.

GIS Day is free and open to the public but we do request that you RSVP, so we know how many participants to expect! Also, we are inviting the geospatial community to participate in GIS Day during our poster, lightening talk, and presentation sessions.  If you’d like to present your work or display a poster, please indicate your interest on the RSVP form. Our RSVP form allows you to register your poster or to be considered for a presentation slot. Please include the title and a brief abstract for your proposed poster or talk on that form. Topics are open to anything geospatial! If you’d like to attend GIS Day 2015, please RSVP here: http://goo.gl/forms/3mj30lc6eS


What: GIS Day 2015 @ the GIF

Location: Mulford Hall, UC Berkeley

Date: Wednesday, November 18th

Time: 5pm – 8:30pm

Tuesday
Oct202015

Where is the best source for NAIP information for California? 

How many times has NAIP been acquired for California? 
According to DFG, we have:

  • NAIP 2014 aerial imagery, 1 m, 4 variations (natural color, 4-band, CIR/false color, NDVI)
  • NAIP 2012 aerial imagery, 1 m, 4 variations (natural color, 4-band, CIR/false color, NDVI) 
  • NAIP 2010 aerial imagery, 1 m, 4 variations (natural color, 4-band, CIR/false color, NDVI) 
  • NAIP 2009 aerial imagery, 1 m, 4 variations (natural color, 4-band, CIR/false color, NDVI) 
  • NAIP 2005 aerial imagery, 1 m (natural color)

I was not aware the flight schedule was this frequent. 

Still, I can't find a definitive information source that helps. 

Errors occurred while processing template[pageRendered/journal.st]:
StringTemplate Error: Can't parse chunk: {settingHomePageKBArticle}" target="_blank">Learn how.</a></li>
<li>If you have already selected a front page, make sure it is enabled. Click on the Cubes icon (top right) and then click the "enable page" button.</li>
</ol>
</div>

: expecting '"', found '<EOF>'
StringTemplate Error: problem parsing template 'pageRendered/noDefaultModule': null