blog authors
past blog entries

Welcome to the Kellylab blog

geospatial matters

Please read the UC Berkeley Computer Use Policy. Only members can post comments on this blog.

Entries in collaboration (36)

Saturday
Jun062015

Spatial Data Science @ Berkeley May 2015

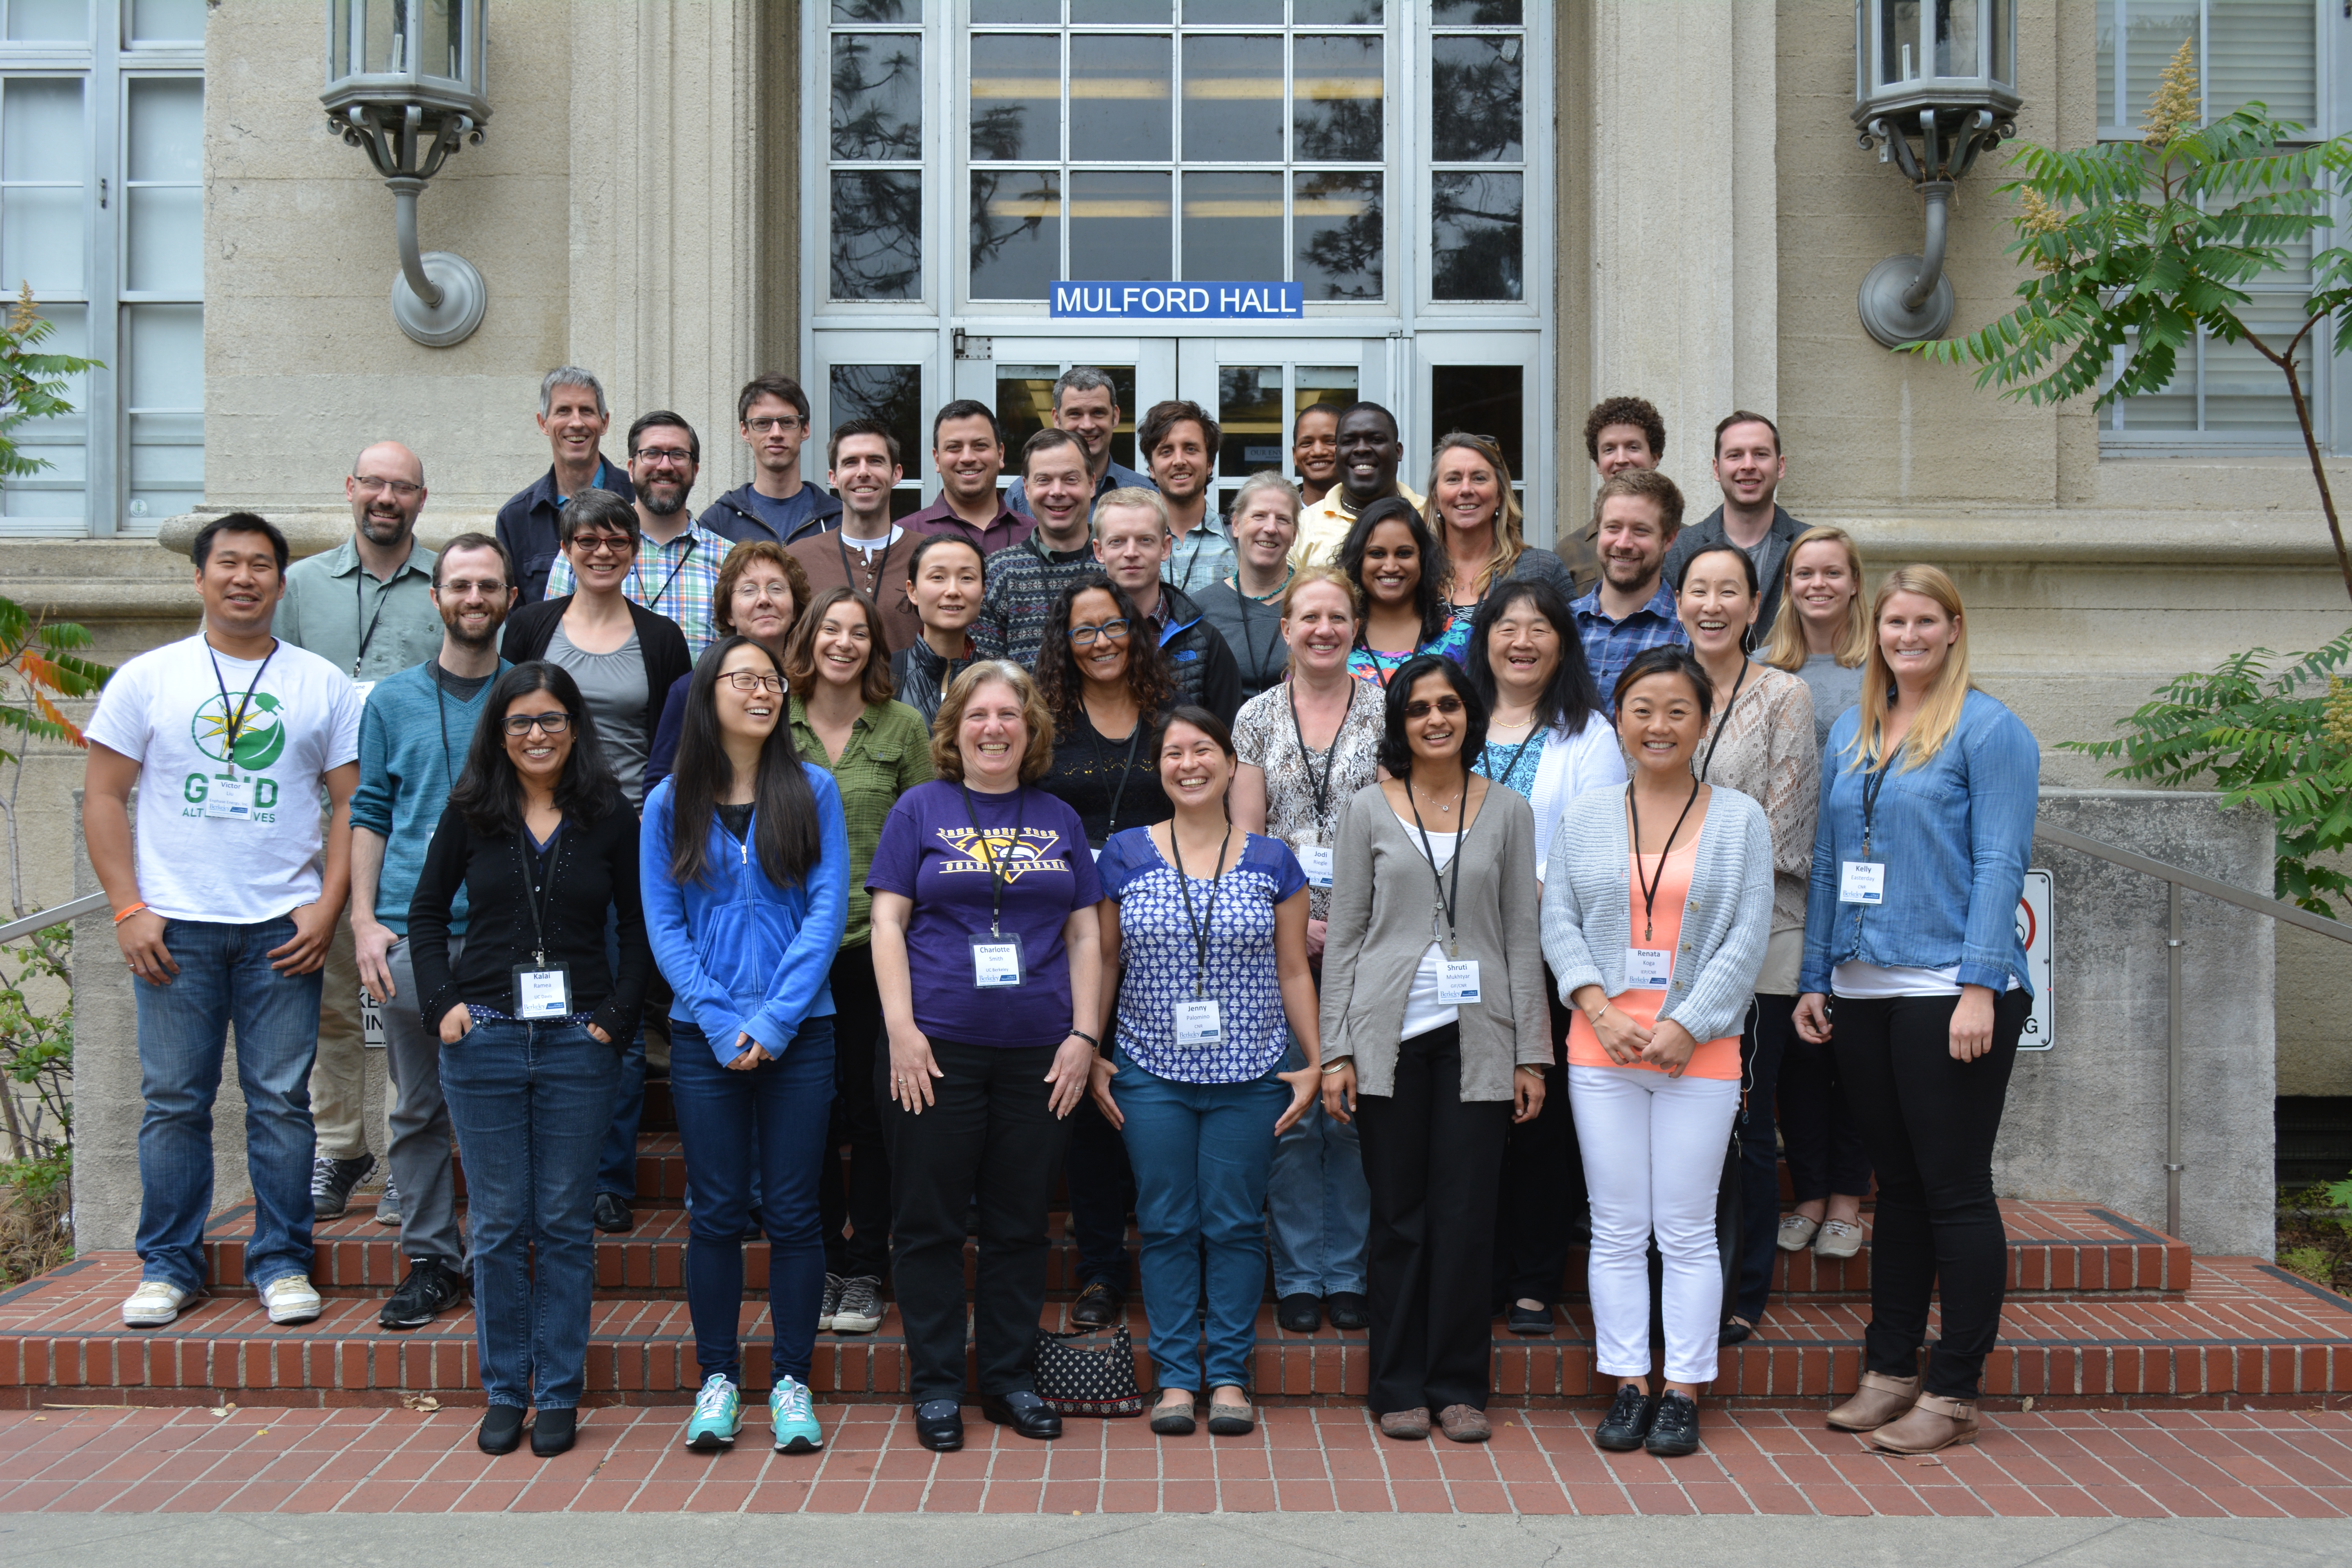
Bootcamp participants outside historic Mulford HallOur bootcamp on Spatial Data Science has concluded. We had three packed days learning about the concepts, tools and workflow associated with spatial databases, analysis and visualizations. 

Our goal was not to teach a specific suite of tools but rather to teach participants how to develop and refine repeatable and testable workflows for spatial data using common standard programming practices.

On Day 1 we focused on setting up a collaborative virtual data environment through virtual machines, spatial databases (PostgreSQL/PostGIS) with multi-user editing and versioning (GeoGig). We also talked about open data and open standards, and modern data formats and tools (GeoJSON, GDAL).

Analyzing spatial data is the best part! On Day 2 we focused on open analytical tools for spatial data. We focused on one particular class of spatial data analysis: pattern analysis, and used Python (i.e. PySAL, NumPy, PyCharm, iPython Notebook), and R Studio (i.e. raster, sp, maptools, rgdal, shiny) to look at spatial autocorrelation and spatial regression. 

Wait, visualizing spatial data is the best part! Day 3 was dedicated to the web stack, and visualization. We started with web mapping (web stack, HTML/CSS, JavaScript, Leaflet), and then focused on web-based visualizations (D3).  Web mapping is great, and as OpenGeo.org says: “Internet maps appear magical: portals into infinitely large, infinitely deep pools of data. But they aren't magical, they are built of a few standard pieces of technology, and the pieces can be re-arranged and sourced from different places.…Anyone can build an internet map."

All-in-all it was a great time spent with a collection of very interesting mapping professionals from around the country (and Haiti!). Thanks to everyone!

Monday
Apr272015

Kelly Lab SPUR Students Visit Point Reyes National Seashore

Kelly Lab SPUR Students Drew Adamski and Ryan Avery have been participating in lab research all semester.  In particular they have been helping classify trails within the Pacific West's National Parks.  This month we were lucky enough to travel out with them to Point Reyes National Seashore to see some of those trails in person.  We were also lucky enough to spend the day with Chief Ranger Schifsky who was kind enough to talk to us about what issues different trails in the park were facing and which trails seemed to be changing most rapidly.  Chief Schifsky was also kind enough to show us some of the points in the park where the landscape had changed dramatically over time due to fire, restoration projects, or differing management strategies.  Overall it was a really inspiring and informative trip!

Friday
Jan232015

Croudsourced view of global agriculture: mapping farm size around the world

From Live Science. Two new maps released Jan. 16 considerably improve estimates of the amount of land farmed in the world — one map reveals the world's agricultural lands to a resolution of 1 kilometer, and the other provides the first look at the sizes of the fields being used for agriculture.

The researchers built the cropland database by combining information from several sources, such as satellite images, regional maps, video and geotagged photos, which were shared with them by groups around the world. Combining all that information would be an almost-impossible task for a handful of scientists to take on, so the team turned the project into a crowdsourced, online game. Volunteers logged into "Cropland Capture" on a computer or a phone and determined whether an image contained cropland or not. Participants were entered into weekly prize drawings.

Friday
Dec192014

The mapping process: musings at the end of 2014

Here are some evocative words about mapping from an unlikely source: in her astounding and engrossing book Wolf Hall, Hilary Mantel has Thomas Cromwell say:

But the trouble is, maps are always last year's. England is always remaking herself, her cliffs eroding, her sandbanks drifting, springs bubbling up in dead ground. They regroup themselves while we sleep, the landscapes through which we move..."

Lovely stuff! and a great holiday read (or re-read, or re-listen). It reminds us that mapping is a continual effort, a continuous process. All that we map changes: crops are harvested and fields are replanted, cities evolve, forests burn and re-grow, and people move across the face of the earth leaving traces. Our task is to capture in virtual space the key functional elements of space and time - through maps, through spectral reflectance and lidar, through text and discussions - so that we can find answers to to the key questions facing society today.

Excerpt From: Mantel, Hilary. Wolf Hall. Henry Holt and Company, 2009. iBooks.

Tuesday
Nov182014

GIS Day 2014!

Discovering the World Through GIS

November 19, 2014, 5PM-8:30PM

UC Berkeley, Mulford Hall

GIS Day took place in Mulford Hall Wednesday Nov 19th from 5-8:30pm. We had about 200 attendees who participated in workshops, listened to talks, saw posters, and networked with other like-minded GIS-enthusiasts.

Some of the activity at 2014 GIS Day in Mulford Hall

See the agenda here: http://gif.berkeley.edu/gisday.html.

Wednesday
Nov122014

Web mapping of high res imagery helps conservation

One of our collaborators on the Sonoma Vegetation Mapping Project has sent work on how web mapping and high resolution imagery has helped them do their job well. These are specific comments, but might be more generally applicable to other mapping and conservation arenas.

  1. Communicating with partnering agencies.
    • In the past year this included both large wetland restoration projects and the transfer of ownership of several thousands of acres to new stewards.
  2. Articulating to potential donors the context and resources of significant properties that became available for purchase.
    • There are properties that have been identified as high priority conservation areas for decades and require quick action or the opportunity to protect would pass.
  3. Internal communication to our own staff.
    • We have been involved in the protection of over 75 properties, over 47,000 acres. At this time we own 18 properties (~6500 acres) and 41 conservation easements (~7000  acres). At this scale high quality aerial imagery is essential to the size of land we steward and effective broad understanding. The way it is served as a seamless mosaic means it is available to extremely experienced and intelligent people who find the process of searching and joining orthorectified imagery by the flight path and row cumbersome or inefficient.
  4. Researching properties of interest.
    • Besides our own internal prioritization of parcels to protect, I understand that we receive a request a week for our organization’s attention towards some property in Sonoma. Orienting ourselves to the place always includes a map with the property boundary using the most recent and/or high quality imagery for the parcel of interest and its neighbors.  This is such a regular part of our process that we created a ArcGIS Server based toolset that streamlines this research task and cartography. The imagery service we consume as the basemap for all these maps is now the 2011 imagery service.  This imagery is of high enough resolution that we can count on it for both regional and parcel scale inspection to support our decisions to apply our resources.
  5. Orienting participants to site.
    • Our On the Land Program uses the imagery in their introduction maps to help visitors on guided hikes quickly orient to the place they are visiting and start folding their experience and sense of place into their visit.
  6. Complementing grant applications.
    • Grants are an important part of the funding for major projects we undertake. High quality imagery facilitates our ability to orient the grant reviewer and visually support the argument we are making which is that our efforts will be effective and worthy of funds that are in short supply.
  7. Knowing what the resources on a property are is an essential part of thoughtfully managing them.
    • In one example we used the aerial imagery (only a year old at the time) as a base map for botanists to classify the vegetation communities. These botanists are not experts in GIS, but by using paper maps with high resolution prints in the field they were easily able to delineate what they were observing on the ground on features interpreted in the photo.  We then scanned and confidently registered their hand annotations to the same imagery, allowing staff to digitized the polygons that represent the habitat observed. These vegetation observations are shared with Sonoma County and its efforts to map all the vegetation of Sonoma County.
  8. Conservation easement monitoring makes extensive use of aerial imagery.
    • In some cases we catch violations of our easements that are difficult to view on the ground, for example unpermitted buildings by neighbors on the lands we protect, illegal agriculture or other encroachment. It is often used to orient new and old staff to a large property before walking their and planning for work projects that might be part of prescribed management.
  9. The imagery helps reinforce our efforts to communicate the challenge to preserve essential connectivity in the developed and undeveloped areas of Sonoma County.
    • In the Sonoma Valley there is a wildlife corridor of great interest to us as conservation priority. Aerial imagery has been an important part of discussing large land holdings such as the Sonoma Developmental Center, existing conserved land by Sonoma Land Trust and others, and the uses of the valley for housing and agriculture.
  10. Celebration of the landscape cannot be forgotten.
    • We often pair this high quality aerial imagery with artful nature photography. The message of the parts and their relation to the whole are succinctly and poetically made. This is essential feedback to members and donors who need to see the numbers of acres protected with their support and have the heartfelt sense of success.

We look forward to the continued use of this data and the effective way it is shared.
 
We hope that future imagery and other raster or elevation data can be served as well as this, it would benefit many engaged in science and conservation.

Thanks to Joseph Kinyon, GIS Manager, Sonoma Land Trust

Wednesday
Jul162014

NEW VTM Reshoot!

Take a look at this awesome VTM reshoot from the folks over at Geographic Resource Solutions (GRS), photographed during a recent mapping project of Lassen Volcanic National Park. Yet another great example and an incredible testament to lasting power of the VTM dataset. This particular photo was taken near the Chaos Crags Jumble in Lassen Volcanic National Park. Thanks to Ken Stumpf and GRS for sharing!

Albert Wieslander (October 1, 1925): Looking N 35 degrees W from 1/4 corner 16/17 T 31-4. Foreground dwarf timber on glacial deposit. Slope in background, section 7 and 8 Tyler Brown of GRS (September,2011): At Accuracy Assessment Site 091646 located in the Chaos Crags Jumble in Lassen Volcanic National Park

In a similar vein I recently stumbled upon another meshing of historical and contemporary photographs. The project features reshoots of the Grand Canyon and resulted in a 2012 book titled: Reconstructing the View: The Grand Canyon Photographs of Mark Klett and Byron Wolfe

Published by University of California Press. You can see a few of the photographer’s recent projects on their website. Historical photos are just the best!


Monday
Jul072014

OakMapper Mobile Updated (v2.4) - available now at the App Store

OakMapper Mobile has been updated (version 2.4) to take take advantage of the latest iOS interface design and requirements. It is available for download at the Apple App Store. Existing OakMapper Mobile users are encouraged to update to the latest version.

In the last 6 months, the site receives over 1,100 visitors, resulting in over 1,450 sessions this period, which is consistent with the same period last year. Visitors come mostly from the US; and within the US states, California dominates. There are 14 new registered users from the community. Participation from the community includes 4 new SOD submissions (721 total), 1 new comment about SOD, 6 new questions/feedback, and 2 new votes on whether they have seen the reported SOD cases.

Our paper published in the Annals of the Association of American Geographers has been cited 17 times according to Google Scholar.


Connors, J. P., S. Lei & M. Kelly (2012): Citizen Science in the Age of Neogeography: Utilizing Volunteered Geographic Information for Environmental Monitoring, Annals of the Association of American Geographers, 102(6): 1267-1289

Thursday
Jul032014

NASA challenge announced: Open NASA Earth Exchange 2014

President Obama has announced a series of executive actions to reduce carbon pollution and promote sound science to understand and manage climate impacts for the U.S. 

Following the President’s call for developing tools for climate resilience, NEX is hosting a workshop that will feature:
  1. Climate science through lectures by experts;
  2. Computational tools through virtual labs; and
  3. A challenge inviting participants to compete for prizes by designing and implementing solutions for climate resilience.

An particularly exciting part of this initiative is the possibility to win cash prizes for innovative research ideas. You can find more information about labs and lectures here at https://nex.nasa.gov/opennex
and to participate in the challenge, you can go directly at https://www.innocentive.com/ar/challenge/9933584.

Pay attention! Especially grad students and young researchers! The first part of the challenge is the ideation challenge which will close on the 31st of July, 2014 and will follow up with another solvers challenge based on the ideas as selected form the ideation challenge. This will run through October so ample time to participate and win prizes.

Saturday
Feb152014

Berkeley Food Institute's new grants announced

The new Berkeley Food Institute has released its crop of funded projects from its first seed grant program. Our project Making the Road by Mapping: Informing Food System Transformation through Participatory Mapmaking was selected for seed funding. This project, led by Kathryn DeMaster includes graduate students Adam Calo (ESPM) and Sarah Van Wart (Information), Darin Jensen (Geography), Tapan Parikh (Information), Kaley Grimland-Mendoza (Agriculture and Land-Based Training Association), Amber Sciligo (Post-doc, ESPM), Christy Getz (ESPM), and Jennifer Sowerwine (Jepson Herbaria). We look forward to digging in.

Our participatory mapping research project has four primary purposes: First, we explore participatory mapping as a way to collaboratively generate new food system knowledge with scholars, practitioners, and producers. Second, through a process we term “communitysourcing,” we aim to illuminate overlooked caches of community-based knowledge and engage community members, agricultural producers and scholars in collaborative efforts to map a particular food system supply chain (small-scale organic strawberry production in the Salinas Valley). Third, we aim to integrate the interdisciplinary community-based participatory research with specific understandings of the way that certain agricultural policies either facilitate or restrict sustainable small-scale organic strawberry production in the Salinas Valley (with a particular focus on water quality and food safety policy/regulations). Fourth, we will present our findings in novel, innovative, and visually captivating ways that will: (a) Inform specific policies/regulations and; (b) Provide small-scale producers with easily accessible caches of community generated knowledge to inform their practices.

http://berkeleyfoodinstitute.org/current-research/