blog authors
past blog entries

Welcome to the Kellylab blog

geospatial matters

Please read the UC Berkeley Computer Use Policy. Only members can post comments on this blog.

Thursday
Dec092010

The mapping brain

This is an interesting article from National Geographic about "The Map and the Mind", which makes the argument that our intellectual maturation as individuals can be traced through the way we draw pictures, or maps, of our surroundings, and that the humble map helped “advance the evolution of abstract thinking” throughout society.

"Nicholas Carr’s new book, The Shallows: What the Internet Is Doing to Our Brains, examines how our intellectual technologies—the tools we use to find, store, and share information—influence the way that we think, from the map and the clock to the book and the Internet. In this excerpt, Carr looks at the map’s far-reaching effects on the intellectual lives of our ancestors."

I assume in the book he talks about internet mapping and LBS, but that will have to wait until I can get my hands on the book.

Friday
Dec032010

Google Earth Engine Debuted at the International Climate Change Conference in Cancun, Mexico

Google.org introduced a new Google Labs product called Google Earth Engine at the International Climate Change Conference in Cancun, Mexico. Google Earth Engine is a new technology platform that puts petabytes of satellite imagery and data from the past 25 years online, many of which have never been seen, much less analyzed. The platform will enable scientists around the world to use Google’s cloud computing infrastructure to implement their applications. For example, creating a detailed forest cover and water map of Mexico, a task that would have taken 3 years on one computer, was accomplished in less than a day.

Google Earth Engine can help scientists track and analyze changes in Earth’s environment  and can be used for a wide range of applications—from mapping and monitoring water resources to ecosystem services to deforestation. The idea is to enable global-scale monitoring and measurement of changes in the earth’s environment by providing scientists a vast new amount of data and powerful computing resources.

Read more at Introducing Google Earth Engine or watch Google Earth Engine Overview videos.

Thursday
Dec022010

walkscore & transitscore maps & methodologies

Following up on our lab discussion today about connectivity, here are the links for walkscore.com and the new transitscore site. Also, there is a walkscore wiki that details how the scores were calculated and rendered.

Wednesday
Dec012010

New Google SketchUp plug-in integrates 3D laser scan data

Pointools has just announced the availability of a new plug-in for Google SketchUp to be released in a few weeks. This new plug-in will make it easy to visualize and use point cloud data from sources such as mobile ground based scans and aerial lidar for 3D model building in Google SketchUp. The plug-in offers built-in support for Google’s geo-location services to coordinate StreetView textures and aerial imagery alongside point clouds. This new tool allows for a new data source to be used to create photo realistic 3D models of buildings and landscapes.

Click here for the full story and here for a video of the plug-in in action.

Image Source: Pointools Wordpress

Wednesday
Dec012010

QGIS 1.6 'Copiapó' released

The folks working on Quantum GIS (QGIS) have recently released a new version of their popular open source desktop GIS application that works on Windows, Mac, and Linux. 

Version 1.6 can now be downloaded from qgis.org via http://download.qgis.org.

There are a lot of new features and bug fixes in this version, adding even more power to use QGIS as a viable analysis platform.  You can read the entire list of new features here.

Be sure to check out the included analysis plugins for:

  • OGR Converter: Convert between more than 30 vector formats, including shapefile, kml, mapinfo, gpx...
  • Interpolation: Interpolate vector data using Triangular Interpolation (TIN) or Inverse Distance Weighting (IDW)
  • Raster Based Terrain Analysis: Convert DEM data to Slope, Aspect, Ruggedness, or Total Curvature
  • Spatial Query: Topological operations include contains, equals, intersects, touches...
  • GDAL Tools: Adds a new drop down list to your menu that includes many GDAL functions like warp, translate, or contour.  This adds a lot of the power of GDAL without the need to write scripts.
  • fTools: Adds a new dropdown list to your menu with many geoprocessing and analysis functions such as buffers, joins, nearest neighbor, vector grid creation...
  • GRASS: Adds a suite of tools that allow you to use much of the GRASS functionality within the QGIS application

If you are relatively new to GIS, and would like to try QGIS, we've just added an introductory tutorial to the GIF's Quick Start Guides based on this latest software release.  Check out the pdf and accompanying data for Introduction to QGIS: Basic geoprocessing and making a map layout


Tuesday
Nov302010

New global map of mangroves

From NASA. Mangroves are among the most biologically important ecosystems on the planet, and a common feature of tropical and sub-tropical coastlines. But ground-based evidence suggests these vital coastal forests have been strained in many regions because of harvesting for food, fuel, and medicine. Now, scientists have used satellite images to compile the most comprehensive map of mangroves worldwide, which should help in future efforts in monitoring and conservation. New global maps of mangroves have been developed.

The effort to create the maps was led by Chandra Giri of the U.S. Geological Survey and published recently in the journal Global Ecology and Biogeography. Using digital image classification techniques, the research team compiled and analyzed more than 1,000 scenes from the Landsat series of satellites.

Giri and colleagues found 12.3 percent less area covered by mangroves than previously estimated by the United Nations Food and Agriculture Organization. The current extent of mangroves is probably half of what once existed. Only 6.9 percent of mangrove forests are protected by law.

See more here.

Wednesday
Nov242010

corridor analysis tools

Alan shared a link with me for Corridor Design. It includes downloads for various GIS Tools, overviews of corridor concepts, and reports on linkage designs. The stated goal is "to transfer everything we've learned about designing wildlife corridors to the general public to facilitate better conservation, science, and dialogue."  Check out the site's blog for info on their latest projects.

Tuesday
Nov232010

National Map of Food Deserts

I live in a Low Access Area! According to a new food desert webGIS, my neighobrhood around 58th & Shattuck doesn't have access to a full-service grocery store, has low car ownership, and low median household income. I have never considered my self to live in a food dessert because I go to Berkeley Bowl at least once a week on my bike ride home from campus, but according to these combined metrics I am more underserved by full-service food stores than most other neighborhoods. I think this is a really neat tool to start a broader conversation about how to measure and evaluate food access and what it means for individual and community health.

As Grist writes...."The point of the project isn't just to map food deserts, it's to help TRF and other investors, as well as policymakers, calculate how much money is "leaking" from an area (being spent elsewhere), so as to evaluate whether a loan for a new supermarket is a good idea -- financially, presumably. As Stephanie covered in her piece, food-justice advocates disagree on whether small, independently owned but somewhat limited food stores are the answer, or chain stores such as a Safeway or Walmart.

Alas, the tool does not include data for health care expenditures or obesity rates in these areas, which would be interesting comparisons to see."


Sunday
Nov142010

GIS Day this week!

GIS Day 2010
November 17, 2010
3:00 pm to 8:30 pm
UC Berkeley, Mulford Hall
http://gif.berkeley.edu/gisday.html

Please join us for GIS Day 2010 on Wednesday, November 17. 
The list of speakers and topics are now available on the event site, including this year’s keynote presentation from Brady Forrest!

GIS Day is free, but we encourage you to register, so that we know how many people to expect.  We still have room for posters, if you’d like to display a poster (project, map, imagery) just sign up online.

This year's event is co-hosted by the Bay Area Automated Mapping Association (BAAMA) and Geospatial Innovation Facility (GIF), with support from the Northern California Region of the American Society for Photogrammetry and Remote Sensing (ASPRS).


Saturday
Nov062010

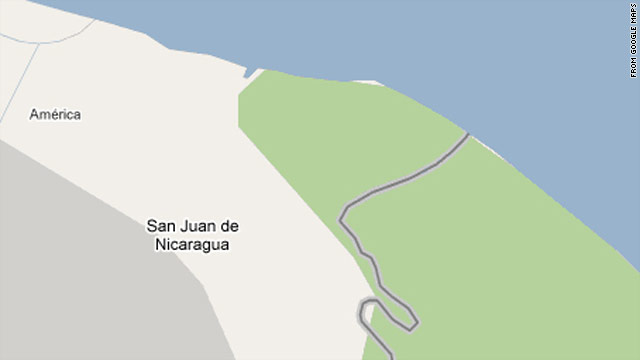
Google Maps border becomes part of international dispute

(CNN) -- The accuracy of Google Maps has been pulled into a debate about the border between two Central American countries.

A Nicaraguan general cited Google's version of the border map as an after-the-fact justification of a reported raid of a disputed area between that country and Costa Rica.

http://www.cnn.com/2010/TECH/web/11/05/nicaragua.raid.google.maps/index.html