blog authors
past blog entries

Welcome to the Kellylab blog

geospatial matters

Please read the UC Berkeley Computer Use Policy. Only members can post comments on this blog.

Wednesday
Oct102012

ESRI MODIS Toolbox

Cool MODIS NDVI tool pointed out to us from Jenny P.

This toolbox contains scripts that download NASA satellite imagery from MODIS and import it into ArcMap. The four data products currently supported are: evapotranspiration, land surface temperature, normalized difference vegetation index (NDVI), and enhanced vegetation index (EVI).

These products are available for the entire surface of the Earth at 1 km resolution and for any month going back to January 2000, when MODIS first launched aboard the satellite Terra.

http://resources.arcgis.com/gallery/file/geoprocessing/details?entryID=9CC382D2-1422-2418-34F8-DC9F97B24052

Tuesday
Oct022012

Food: An Atlas by Guerrilla Cartographers is ready for your support!

An atlas of food: a cooperatively-created, crowd-sourced and crowd-funded project of guerrilla cartography and publishing. Check it out! Food: An Atlas is ready to roll. Check out the promo at kickstarter and consider supporting the project.

5 months
+ 80 collaborating cartographers and researchers
+ 8 volunteer editors
+ An abundance of volunteer campaign wranglers, academics, designers, and artists
+ You
= Food: An Atlas

Tuesday
Oct022012

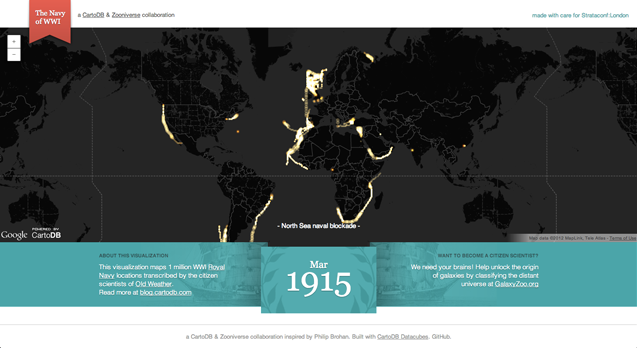
CartoDB launches tools for visualizing temporal data

CartoDB, a robust and easy to use web mapping application, today launched "torque" a new feature enabling visualization of temporal data sets. 

From the CartoDB team:

Torque is a library for CartoDB that allows you to create beautiful visualizations with temporal datasets by bundling HTML5 browser rendering technologies with an efficient data transfer format using the CartoDB API. You can see an example of Torque in action on the Guardian's Data Blog, and grab the open source code from here.

Be sure to check out the example based on location data recorded from Captain's logs from the British Royal Navy during the first World War.  Amazing stuff!


Wednesday
Sep262012

New green blog about our web participation paper

Check it out! our recent paper on the SNAMP website is featured in the green blog.

Monday
Sep242012

Land Change Science Position Open!

We are very excited to have open a new Cooperative Extension specialist position in Land Change Science. The successful Land Change CE specialist will have a PhD, and will develop a vibrant applied research program, primarily based in California. There are no formal teaching duties with this position, instead, the incumbant will have outreach and extension duties.

We are searching for someone who can help us understand, predict and plan for the complexities of land use change in California. This might be someone from geography, landscape ecology, sociology, or economics, for example, and might focus on planning, modeling or observations of land change, biophysical feedbacks from land change, or spatial analysis. But they must be an adept and capable communicator who can speak to diverse audiences, from landowners, to politicians, to farmers, to scientists, to planners, to citizens.

The Specialist would provide science-based solutions and bridge conflicting interests with knowledge, targeted research, and local education regarding the relationships between expanding population and climate change, and the remaining matrix of wild landscapes, urban areas, working landscapes and agriculture.

The Specialist would provide resources for county-based Cooperative Extension personnel, including learning from UCCE personnel about the needs of decision makers at the local level, and acting as a information and training resource for the use of new tools (GIS, remote sensing, smart phone applications, etc.) for land use analysis.

Please consider applying if this fits you! I will be happy to answer questions.

Monday
Sep242012

Pre-development Delta report from SFEI

The San Francisco Estuary Institute-Aquatic Science Center is pleased to announce the publication of its latest report, Sacramento-San Joaquin Delta Historical Ecology Investigation: Exploring Pattern and Process. The report is the culmination of several years of research synthesizing thousands of pieces of historical evidence with contemporary scientific understanding. The report provides new information about how the Delta functioned to provide habitat for native species and includes dozens of rarely seen historical accounts, maps, and photographs. For more information, please see today's press release.

The report and Geographic Information System (GIS) data are available for download here. Printed copies of the report will be available in several weeks, at a cost of $75 each (plus tax/shipping).

Media Contacts:
Robin Grossinger, Senior Scientist, San Francisco Estuary Institute-Aquatic Science Center, (510) 746-7380 (office), 510 326 3732 (cell), or robin@sfei.org

Carl Wilcox, Policy Advisor to the Director for the Bay-Delta, California Department of Fish and Game, (707) 738-4134, or cwilcox@dfg.ca.gov

Friday
Sep212012

Welcome to Columbus, OH! GIScience in the heartland

Welcome to Ohio! When I arrived, Columbus was cloudy and warm, with the city in a buzz from a visit from President Obama.

GIScience 2012 was an amazing conference: small (~300 people) and focused, with a terrific program: 2 keynotes each morning, sessions through the day and a panel session of 6 speakers in the evenings. I went to sessions on spatial uncertainty, the geoweb (where Renee Sieber gave a terrific talk on the challenges of participation in webGIS (I learned a ton!)), and big data among others, and Thomas Blaschke and I organized a workshop on obia. The keynotes were especially satisfying: big picture, often provocative talks from gifted speakers. Helen Couclelis talked about her vision of GIScience as a meta science: an "information oriented, context sensitive, spatially referenced, method of representing the real world". I loved the discussion of intentionality and context in her talk, and overall it gave me so much to think about. Noel Cressie showed his group's work modeling uncertainty in a North American regional climate change model: summer is going to be hotter in the North American south, and winter is going to be warmer in the Canadian north, no matter how you slice it. Jack Dongarra gave a riveting talk on the future of supercomputing: he walked us through the building of a supercomputer from an individual core, and made clear the power, software and hardware requirements of these machines. Doug Richardson presented his high level perspective on GIS and health; he and the AAG have been working hard to make geoinformatics more evident in public health research through workshop, grants and tireless lobbying. Also a great treat was my visit with Desheng Liu, former lab member, who is now Associate Professor of Geography and Statistics at Ohio State University. We spent some time walking around the lovely campus and catching up. I also got to visit, very briefly, the Thurber House, home of one of my favs James Thurber, who went to OSU and lived in Columbus. Great stuff! As for our workshop, here are the key items the participants were interested in (in order of popularity): terminology, the future of geobia, integration with GIS, semantics, accuracy, change, standards, learning from the past.

Thursday
Sep202012

New study on diabetes risk and neighborhood walkability

The reading for this week's GIS class on vector analysis discussed network buffer measures of neighborhood walkability, and the class came up with numerous components of the built and social environment that the authors didn't include in their land-use based walkability measure that also likely influence people's walking behaviors (e.g. destinations to walk to, crime/safety, trees and greenness, sidewealk quality and ramps, traffic, disincentives from parking costs, etc.). It was a great discussion! I just came acrosos this write-up about a recent article in the journal Diabetes Care that finds a strong relationship between neighborhood walkability and diabetes risk, especially for low-income immigrants. The UC Library doesn't have online access to the most recent one month of articles for this journal, so I haven't been able to look at the full methodolgy for their walkabilty measure. But, I wanted to note it here and will follow-up later with details. Or, if anyone finds access to the full article, please let me know!


Thursday
Sep202012

Cool cartography--Risk mapping at a broad view

I came across this short blurb by  on some tricks for catchy large-scale maps. The bullet-points include:

  • Interesting Topic.  The subjects of these maps inherently represent risk, which we want to understand.
  • Unexpected Scope.  A forest view of something that’s usually seen at the tree-level offers satisfying perspective.
  • Big and Clear.  A single dataset is conceptually simple, and when large enough, it provides its own context-promoting conversation in the wild.
  • Sharable.  A static image is portable and paste-able, easily nestling into articles, blogs, tweets, and PowerPoints.
  • Attractive.  The currency of design buys a second or third look.

There is often a push to make large datasets available through interactive webGIS portals, but I think this makes a good case that there is still also a role for skilled cartography to present information in captivating ways. 

Below is an example of one of the author's (John Nelson) maps, and more can be found here

Tuesday
Sep112012

San Francisco Bay fog viewed from space

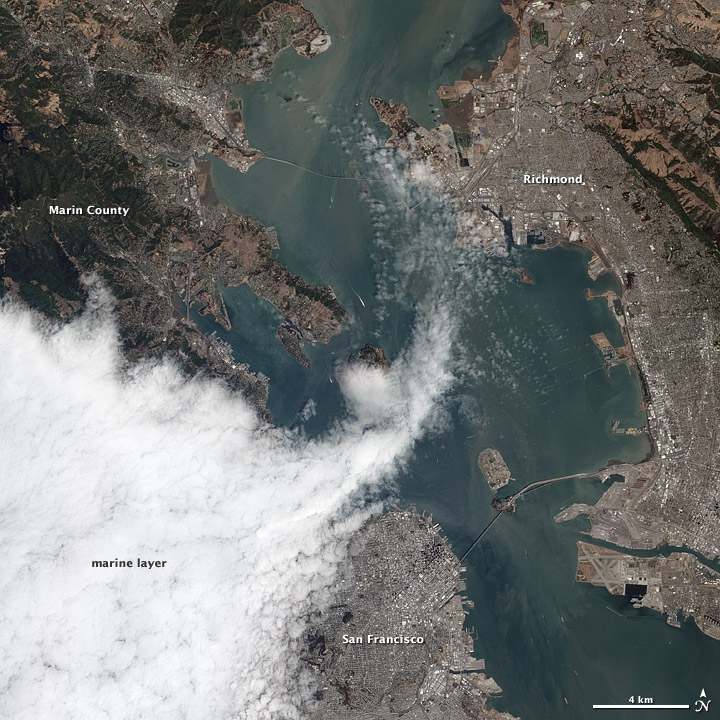
Here is a neat satellite image released by NASA Earth Observatory of fog rolling into the San Francisco Bay. The Advanced Land Imager (ALI) on NASA’s Earth Observing-1 satellite acquired this image on August 16, 2012. For more information on the image and the story behind click here.

Credit: NASA Earth Observatory: Advanced Land Imager (ALI) August 16, 2012