publications by year

Selected Publications

My CV can be found here, my Google Scholar page is here and my Research Gate page is here. Links to directly downloadable papers are provided when possible - these are for individual use only; links to journals are also provided, but might not be available to users without campus library access. All papers are available upon request.

Entries in remote sensing (51)

Thursday
Dec182014

The need to validate remote sensing of crime

Kelly, A. and M. Kelly. 2014. Validating the remotely sensed geography of crime: a review of emerging issues. Remote Sensing 6(12): 12723-12751

This paper explores the existing literature on the active detection of crimes using remote sensing technologies.  The paper reviews sixty-one studies that use remote sensing to actively detect crime.  Considering the serious consequences of misidentifying crimes or sites of crimes (e.g. opening that place and its residents up to potentially needless intrusion, intimidation, surveillance, or violence), the authors were surprised to find a lack of rigorous validation of the remote sensing methods utilized in these studies.

Click to read more ...

Monday
Jun232014

Quantifying ladder fuels with lidar

Kramer, H. A., B. Collins, M. Kelly, S. Stephens. Quantifying ladder fuels in forests: a new approach using LiDAR. Forests 5:1432-1453

We investigated the relationship between LiDAR and ladder fuels in the northern Sierra Nevada, California USA. LiDAR has only been used to address this question peripherally and in only a few instances. After establishing that landscape fuel treatments reduced canopy and ladder fuels at our site, we tested which LiDAR-derived metrics best differentiated treated from untreated areas. The percent cover between 2 and 4 m had the most explanatory power to distinguish treated from untreated pixels across a range of spatial scales.

Click to read more ...

Monday
May052014

Mapping wetland biomass with three remote sensors

Byrd, K.B., J.L. O'Connell, S. Di Tommaso, and M. Kelly. 2014. Evaluation of sensor types and environmental controls on mapping biomass of coastal marsh emergent vegetation. Remote Sensing of Environment 149: 166-180

One of our biomass maps, this one from Mayberry slough

We modeled biomass of emergent vegetation with field spectrometer and satellite data from Landsat, Hyperion and WorldView-2 sensors. Use of narrowbands did not significantly improve biomass predictions over broadbands. Water inundation interacting with plant structure controlled biomass model accuracy. Shortwave infrared bands and multi-temporal datasets improved biomass prediction. These types of maps will track Blue Carbon, sea level rise and land use effects in coastal marshes.

Pdf download. Journal link.

Key words: emergent vegetation, hyperspectral sensor, field spectroscopy, multispectral sensor, water inundation, Blue Carbon, wetland management, error reporting.

Monday
Mar102014

Using remote sensing to model biomass accumulation in a wetland plant

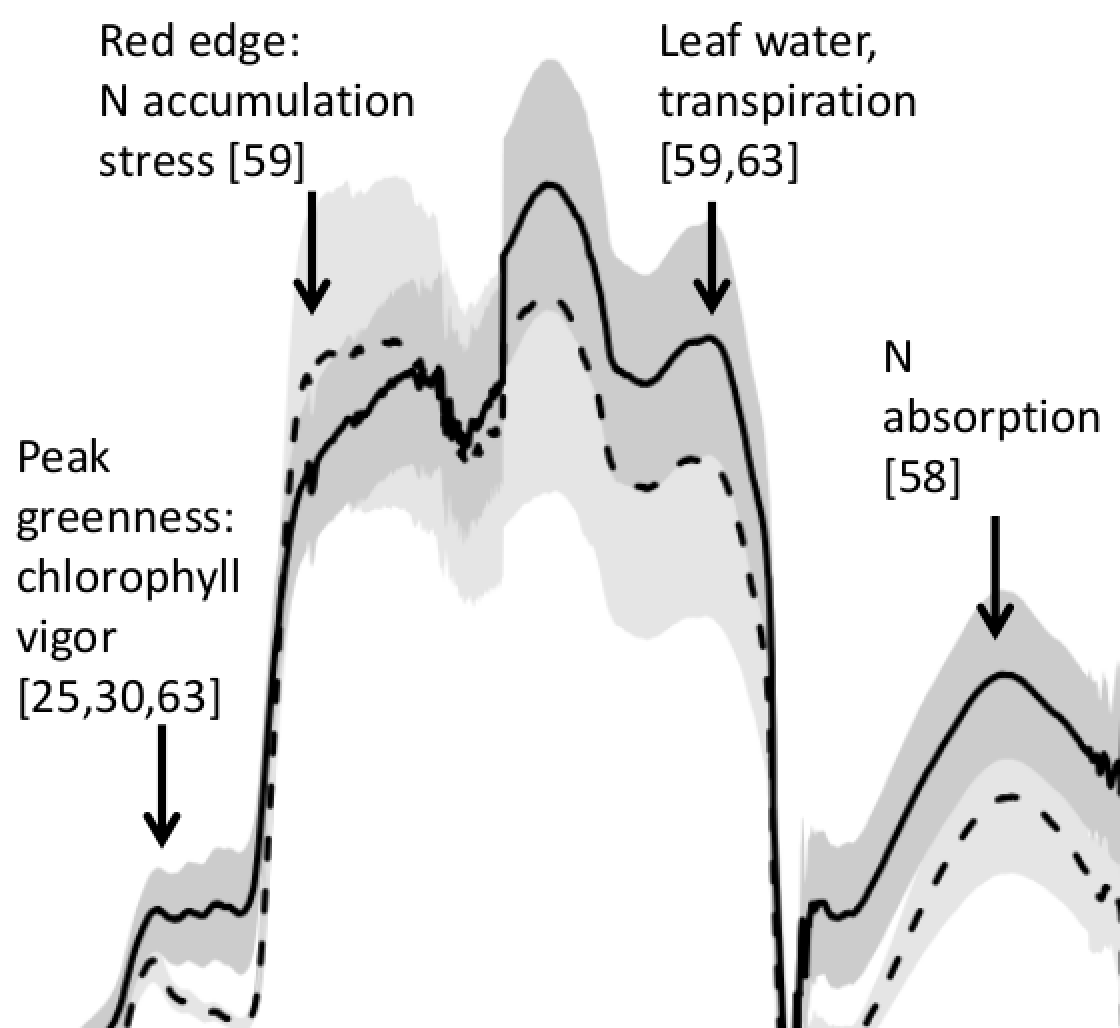
Some of the reflectance spectra for S. acutusO’Connell, J.L., K.B. Byrd, M. Kelly. 2014. Remotely-sensed indicators of N-related biomass allocation in Schoenoplectus acutus. PLOS One. 9(3):e90870

Coastal marshes depend on belowground biomass of roots and rhizomes to contribute to peat and soil organic carbon, accrete soil and alleviate flooding as sea level rises. For nutrient-limited plants, eutrophication has either reduced or stimulated belowground biomass depending on plant biomass allocation response to fertilization. Within a freshwater wetland impoundment receiving minimal sediments, we used experimental plots to explore growth models for a common freshwater macrophyte, Schoenoplectus acutus. We used N-addition and control plots (4 each) to test whether remotely-sensed vegetation indices could predict leaf N concentration, root:shoot ratios and belowground biomass of S. acutus. N-addition did not alter whole plant, but reduced belowground biomass 36% and increased aboveground biomass 71%. We correlated leaf N concentration with known N-related spectral regions using all possible normalized difference (ND), simple band ratio (SR) and first order derivative ND (FDN) and SR (FDS) vegetation indices.

Click to read more ...

Sunday
Dec152013

Geographic Object-Based Image Analysis – Towards a new paradigm

A forest stand with sudden oak death: three common image spatial resolutions: 30 m, 4 m and 1 m.Blaschke, T., G.J. Hay, M. Kelly, S. Lang, P. Hofmann, E. Addink, R. Feitosa, F. Van Der Meer, H. Van Der Werff, F. Van Coillie, D. Tiede. 2014. Geographic Object-based Image Analysis: a new paradigm in Remote Sensing and Geographic Information Science. ISPRS International Journal of Photogrammetry and Remote Sensing 87(1), 180-191.

The amount of scientific literature on (Geographic) Object-based Image Analysis – GEOBIA has been and still is sharply increasing. These approaches to analysing imagery have antecedents in earlier research on image segmentation and use GIS-like spatial analysis within classification and feature extraction approaches. This article investigates these development and its implications and asks whether or not this is a new paradigm in remote sensing and Geographic Information Science (GIScience).

Click to read more ...

Tuesday
Nov262013

Mapping weeds with UAV and obia

On-ground photographs and UAV images of the 1x1-m frames used in the ground-truth samplingPeña JM, Torres-Sánchez J, de Castro AI, Kelly M, López-Granados F. 2013. Weed Mapping in Early-Season Maize Fields Using Object-Based Analysis of Unmanned Aerial Vehicle (UAV) Images. PLoS ONE 8(10): e77151. doi:10.1371/journal.pone.0077151

The use of remote imagery captured by unmanned aerial vehicles (UAV) has tremendous potential for designing detailed site-specific weed control treatments in early post-emergence, which have not possible previously with conventional airborne or satellite images. A robust and entirely automatic object-based image analysis (OBIA) procedure was developed on a series of UAV images using a six-band multispectral camera (visible and near-infrared range) with the ultimate objective of generating a weed map in an experimental maize field in Spain. The OBIA procedure combines several contextual, hierarchical and object-based features and consists of three consecutive phases: 1) classification of crop rows by application of a dynamic and auto-adaptive classification approach, 2) discrimination of crops and weeds on the basis of their relative positions with reference to the crop rows, and 3) generation of a weed infestation map in a grid structure. The estimation of weed coverage from the image analysis yielded satisfactory results.

Click to read more ...

Thursday
Oct172013

A proposed early-warning fire detection system

our graphic of the FUEGO conceptPennypacker, CR, MK Jakubowski, M Kelly, M Lampton, C Schmidt, S Stephens, and R Tripp.  2013. FUEGO—Fire Urgency Estimator in Geosynchronous Orbit—A proposed early-warning fire detection system. Remote Sensing 5(10): 5173-5192

Current and planned wildfire detection systems are impressive but lack both sensitivity and rapid response times. A small telescope with modern detectors and significant computing capacity in geosynchronous orbit can detect small (12 m2) fires on the surface of the earth, cover most of the western United States (under conditions of moderately clear skies) every few minutes or so, and attain very good signal-to-noise ratio against Poisson fluctuations in a second. Hence, these favorable statistical significances have initiated a study of how such a satellite could operate and reject the large number of expected systematic false alarms from a number of sources. Here we present both studies of the backgrounds in Geostationary Operational Environmental Satellites (GOES) 15 data and studies that probe the sensitivity of a fire detection satellite in geosynchronous orbit.

Click to read more ...

Thursday
Aug222013

Delineating individual trees from lidar data

One SNAMP forest plot viewed with lidar dataJakubowski, MK, L Wenkai, Q Guo, and M Kelly. 2013. Delineating individual trees from lidar data: a comparison of vector- and raster-based segmentation approaches. Remote Sensing 5, 4163-4186; doi:10.3390/rs5094163

This work concentrates on delineating individual trees from discrete lidar data in topographically-complex, mixed conifer forest across the California’s Sierra Nevada. We delineated individual trees using vector data and a 3D lidar point cloud segmentation algorithm, and using raster data with an object-based image analysis (OBIA) of a canopy height model (CHM). The two approaches are compared to each other and to ground reference data. We used high density (9 pulses/m2), discreet lidar data and WorldView-2 imagery to delineate individual trees, and to classify them by species or species types.

Click to read more ...

Tuesday
Feb052013

Plant litter influences remote sensing signatures in wetlands

Correlation between fAPAR-hig and two-band vegetation indices usingsimulated Hyperion bands using spectroradiometer data collected at Twitchell IslandSchile, L. K. Byrd, L. Windham-Myers, and M. Kelly. 2013. Accounting for plant litter in remote sensing based estimates of carbon flux in wetlands.  Remote Sensing Letters 4(6):542-551

Monitoring productivity in coastal wetlands is important due to their high carbon sequestration rates and potential role in climate change mitigation. We tested agricultural- and forest-based methods for estimating the fraction of absorbed photosynthetically active radiation (ƒAPAR), a key parameter for modeling gross primary productivity (GPP), in a restored, managed wetland with a dense litter layer of non-photosynthetic vegetation, and we compared the difference in canopy light transmission between a tidally influenced wetland and the managed wetland.

Click to read more ...

Thursday
Jan172013

Capturing forest fuel characteristics with lidar

Jakubowski, M. K., Q. Guo, B. Collins, S. Stephens, and M. Kelly. 2013. Predicting surface fuel models and fuel metrics using lidar and CIR imagery in a dense, mountainous forest. Photogrammetric Engineering and Remote Sensing 79(1):37-49

We compared the ability of several classification and regression algorithms to predict forest stand structure metrics and standard surface fuel models. Our study area spans across a dense, topographically complex Sierra Nevada mixed-conifer forest. We used clustering, regression trees, and support vector machine algorithms to analyze high density (average 9 pulses/m2), discrete return, smallfootprint lidar data, along with multispectral imagery. Stand structure metric predictions generally decreased with increased canopy penetration. While the general fuel types were predicted accurately, specific surface fuel model predictions were poor using all algorithms. These fuel components are critical inputs for wildfire behavior modeling, which ultimately support forest management decisions.

Click to read more ...