New paper: Change detection in urban settings with pixel-based+obia methods
Xiao, P, X Zhang, D Wang, M Yuan, X Feng, M Kelly. 2016. Change detection of built-up land: A framework of combining pixel-based detection and object-based recognition. ISPRS Journal of Photogrammetry and Remote Sensing 119; 402–414
This study proposed a new framework that combines pixel-level change detection and object-level recognition to detect changes of built-up land from high-spatial resolution remote sensing images.
 obia, remote sensing
 New report in press: Mapping forest conditions for the California spotted owl
Kelly, M. In Press. Mapping Forest Conditions Past, Present, and Future. Chapter 6 in Gutiérrez, R.J.; Manley, Patricia N.; Stine, Peter A., tech. eds. [In press]. The California spotted owl: current state of knowledge. Gen. Tech. Rep. PNW-GTR. Albany, CA: U.S. Department of Agriculture, Forest Service, Pacific Southwest Research Station.
Mapping and mapped data have always been critical to public land managers and researchers to identify and characterize wildlife habitat across scales, to monitor species and habitat change, and to predict and plan for future scenarios. Maps and mapping protocols are often incorporated into wildlife and habitat management plans, as is the case with the California spotted owl (Strix occidentalis occidentalis), a subspecies of management concern. In this chapter I have focused on the use of mapping technology that can be used to aid in the analysis of owl use of forested habitat.
New paper: Mapping forest fuel treatments using Lidar
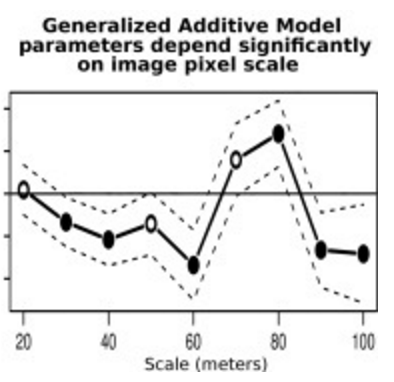
Su, Y, Q Guo, B M Collins, D L Fry, T Hu, and M Kelly. 2016. Forest fuel treatment detection using multi-temporal airborne lidar data and high-resolution aerial imagery: a case study in the Sierra Nevada Mountains, California. International Journal of Remote Sensing 37(14): DOI: 10.1080/01431161.2016.1196842
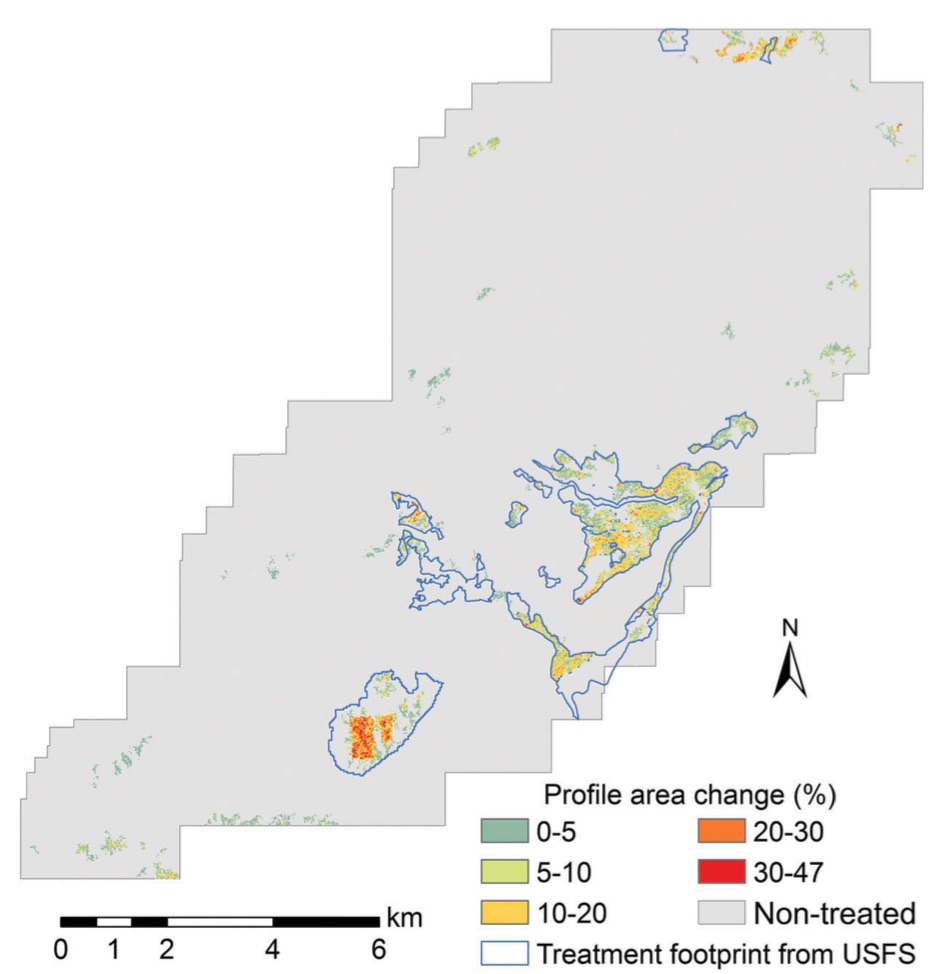 Forest change detection using lidarTreatments to reduce forest fuels are often performed in forests to enhance forest health, regulate stand density, and reduce the risk of wildfires. Although commonly employed, there are concerns that these forest fuel treatments (FTs) may have negative impacts on certain wildlife species. Often FTs are planned across large landscapes, but the actual treatment extents can differ from the planned extents due to operational constraints and protection of resources (e.g. perennial streams, cultural resources, wildlife habitats). Identifying the actual extent of the treated areas is of primary importance to understand the environmental influence of FTs. Light detection and ranging (lidar) is a powerful remote-sensing tool that can provide accurate measurements of forest structures and has great potential for monitoring forest changes. This study used the canopy height model (CHM) and canopy cover (CC) products derived from multi-temporal airborne laser scanning (ALS) data to monitor forest changes following the implementation of landscape-scale FT projects.
forests, lidar, remote sensing, snamp New paper: mapping vegetation with lidar and aerial imagery
Su, Y, Q Guo, D L Fry, B M Collins, M Kelly, J P Flanagan & J J Battles. 2016. A Vegetation Mapping Strategy for Conifer Forests by Combining Airborne Lidar Data and Aerial Imagery. Canadian Journal of Remote Sensing 42:1–15 DOI: 10.1080/07038992.2016.1131114
Accurate vegetation mapping is critical for natural resources management, ecological analysis, and hydrological modeling, among other tasks. Remotely sensed multispectral and hyperspectral imagery have proved to be valuable inputs to the vegetation mapping process, but they can provide limited vegetation structure characteristics, which are critical for differentiating vegetation communities in compositionally homogeneous forests. Light detection and ranging (lidar) can accurately measure the forest vertical and horizontal structures, and provide a great opportunity for solving this problem. This study introduces a strategy using both multispectral aerial imagery and lidar data to map vegetation composition and structure over large spatial scales.
New paper: Challenges and opportunities in synthesizing historical geospatial data
Eitzel, M V, Kelly, M, Dronova, I, Valachovic, Y, Quinn-Davidson, L, Solera, J, and de Valpine, P. 2016. Challenges and opportunities in synthesizing historical geospatial data using statistical models, Ecological Informatics 31: 100–111
 We classified land cover types from 1940s historical aerial imagery using Object Based Image Analysis (OBIA) and compared these maps with data on recent cover. Few studies have used these kinds of maps to model drivers of cover change, partly due to two statistical challenges: 1) appropriately accounting for spatial autocorrelation and 2) appropriately modeling percent cover which is bounded between 0 and 100 and not normally distributed. We studied the change in woody cover at four sites in California’s North Coast using historical (1948) and recent (2009) high spatial resolution imagery.
Mapping relative differences in belowground biomass in wetlands
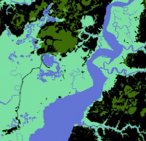
O’Connell, JL, KB Byrd, and M Kelly. 2015. A Hybrid Model for Mapping Relative Differences in Belowground Biomass and Root:Shoot Ratios Using Spectral Reflectance, Foliar N and Plant Biophysical Data within Coastal Marsh. Remote Sensing 7, 16480-16503
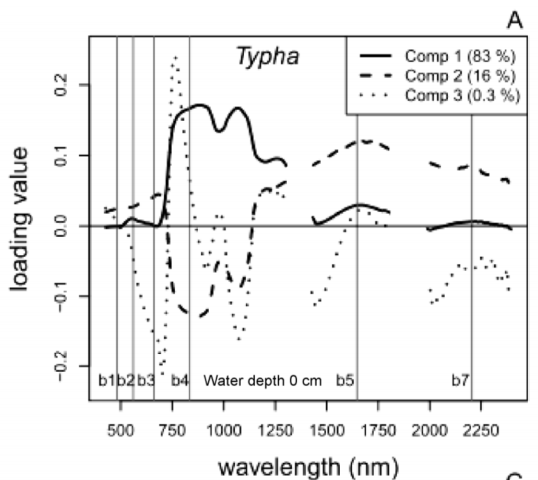 Loadings values of % foliar N from PLS regression of hyperspectral data for Typha spp. Broad-scale estimates of belowground biomass are needed to understand wetland resiliency and C and N cycling, but these estimates are difficult to obtain because root:shoot ratios vary considerably both within and between species. We used remotely-sensed estimates of two aboveground plant characteristics, aboveground biomass and % foliar N to explore biomass allocation in low diversity freshwater impounded peatlands (Sacramento-San Joaquin River Delta, CA, USA). We developed a hybrid modeling approach to relate remotely-sensed estimates of % foliar N (a surrogate for environmental N and plant available nutrients) and aboveground biomass to field-measured belowground biomass for species specific and mixed species models.
Book chapter: OBIA history and futures
Blaschke, Thomas, Maggi Kelly, and Helena Merschdorf. Object-Based Image Analysis: Evolution, History, State of the Art, and Future Vision. Chapter 14 in Prasad Thenkabail (Editor) Remotely Sensed Data Characterization, Classification, and Accuracies. Taylor & Francis. 678 pp.
More fun with Thomas Blaschke delving into the history of obia and discussing possible new developments. An except of my bit on the Colwell-era antecedants of OBIA:
The conceptual foundations of OBIA are rooted in the 1960s with predigital aerial photography. e spatial information found in digital imagery that is harnessed in the object-based approach, for example, image texture, contextual information, pixel proximity, and geometric attributes of features, were discussed in the 1960s as possible components to yet possible automation of photo interpretation. In his seminal work on aerial photography and early remote sensing applications, Colwell (1965) describes the photo interpretation process as the act of examining photographic images for the purpose of identifying objects and judging their significance. He said that photo interpretation involves the observation of the size, shape, shadow, tone, texture, pattern, and location of the features, as well as the significance of the features, based largely on their interrelationships or association (Colwell 1965). His assessment of the potential for automation of an object recognition process depended on the capacities of a digital scanner and the ability of an algorithm to assess the differences, in photographic tone, between a "blob" and its surroundings (Colwell 1964, 1965). Colwell was an important advisor on the Landsat 1 mission, and his ideas on extraction of meaningful features transferred to his ambitions for the satellite missions (Colwell 1973).
historic, obia, remote sensing The HyspIRI sensor for wetland observation
Turpie, K R, V V Klemas, K Byrd, M Kelly and Y Lo. 2015. Prospective HyspIRI global observations of tidal wetlands Remote Sensing of Environment, 16: 206-217
 Tidal wetlands are highly productive and act as critical habitat for a wide variety of plants, fish, shellfish, and other wildlife. These ecotones between aquatic and terrestrial environments also provide protection from storm damage, run-off filtering, and recharge of aquifers. For wetland protection and sensible coastal development, there is a need to monitor these ecosystems at global and regional scales. This paper describes how the HyspIRI hyperspectral and thermal infrared sensors can be used to study and map key ecological properties, such as species composition, biomass, hydrology, and evapotranspiration of tidal salt and brackish marshes and mangroves, and perhaps other major wetland types, including freshwater marshes and wooded/shrub wetlands.
Lidar + MODIS to upscale predictions of forest biomass
Li, L., Q. Guo, S. Tao, M. Kelly, and G. Xu. 2015. Lidar with multi-temporal MODIS provide a means to upscale predictions of forest biomass. ISPRS Journal of Photogrammetry and Remote Sensing. 102: 198–208
 Forests play a key role in the global carbon cycle, and forest above ground biomass (AGB) is an important indictor to the carbon storage capacity and the potential carbon pool size of a forest ecosystem. Accurate estimation of forest AGB has become increasingly important for a wide range of end-users. Although satellite remote sensing provides abundant observations to monitor forest coverage, validation of coarse-resolution AGB derived from satellite observations is difficult because of the scale mismatch between the footprints of satellite observations and field measurements. In this study, we use airborne Lidar to bridge the scale gaps between satellite-based and field-based studies, and evaluate satellite-derived indices to estimate regional forest AGB.
carbon, forests, last chance, lidar, remote sensing, snamp, sugar pine Monitoring residual dry matter on rangelands with remote sensing
Tsalyuk, M., M. Kelly, K. Koy, W. M. Getz, and H. S. Butterfield. 2015. Monitoring the Impact of Grazing on Rangeland Conservation Easements Using MODIS Vegetation Indices. Rangeland Ecology and Management 68(2): 173–185
Residual dry matter (RDM), the dry grass biomass left on the ground in the fall, is a widely used proxy for rangeland conditions. We developed a method to efficiently monitor RDM using time series of three Moderate Resolution Imaging Spectroradiometer (MODIS) satellite-based vegetation indices (VIs). We found a significant correlation between RDM and the VIs, especially the Leaf Area Index (LAI), which predicts compliance with RDM conservation easement terms. Our rangeland management model uses time series of MODIS VIs to predict forage quantities, manage stocking rates, and monitor rangeland easement compliance, efficiently, rapidly, and reliably. Journal Link
